| Red | Green | Blue | |
| z | 17.64 | ||
| znorm | Inf | ||
| sky | -Inf | -Inf | -Inf |
| S/N | 26.2 | 39.9 | 42.4 |
| S/N(c) | 0.0 | 0.0 | 0.0 |
| SN(E/C) |


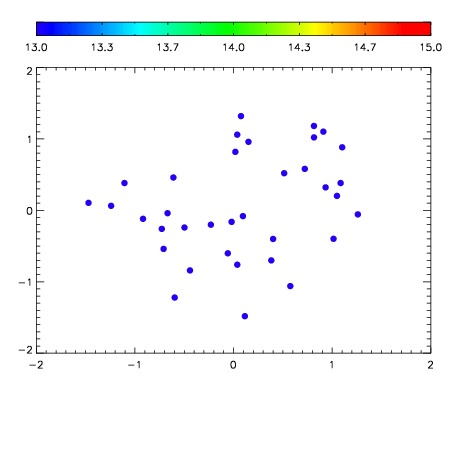

| Frame | Nreads | Zeropoints | Mag plots | Spatial mag deviation | Spatial sky 16325A emission deviations (filled: sky, open: star) | Spatial sky continuum emission | Spatial sky telluric CO2 absorption deviations (filled: H < 10) | |||||||||||||||||||||||
| 0 | 0 |
|
|
|
|
|
|
| IPAIR | NAME | SHIFT | NEWSHIFT | S/N | NAME | SHIFT | NEWSHIFT | S/N |
| 0 | 09040038 | 0.483708 | 0.00000 | 87.5849 | 09040040 | 0.00466325 | 0.479045 | 132.906 |
| 1 | 09040035 | 0.480950 | 0.00275800 | 154.184 | 09040036 | 0.00360152 | 0.480106 | 154.598 |
| 2 | 09040034 | 0.479185 | 0.00452301 | 149.047 | 09040033 | 0.00000 | 0.483708 | 144.892 |
| 3 | 09040039 | 0.482648 | 0.00106001 | 131.414 | 09040037 | 0.00386771 | 0.479840 | 134.309 |