| Red | Green | Blue | |
| z | 17.64 | ||
| znorm | Inf | ||
| sky | -Inf | -Inf | -Inf |
| S/N | 24.8 | 40.1 | 42.1 |
| S/N(c) | 0.0 | 0.0 | 0.0 |
| SN(E/C) |
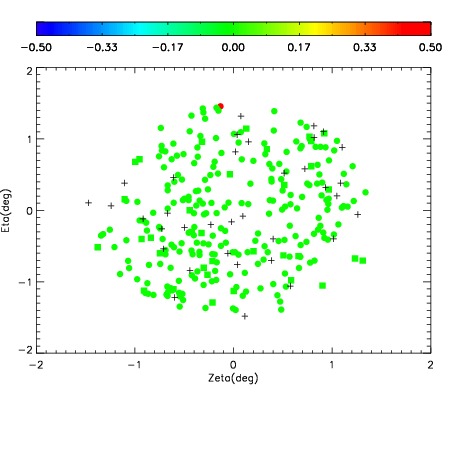
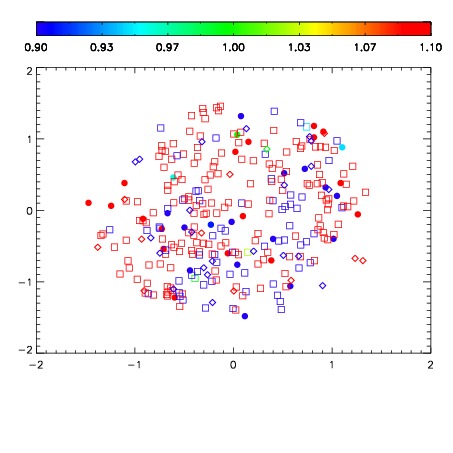
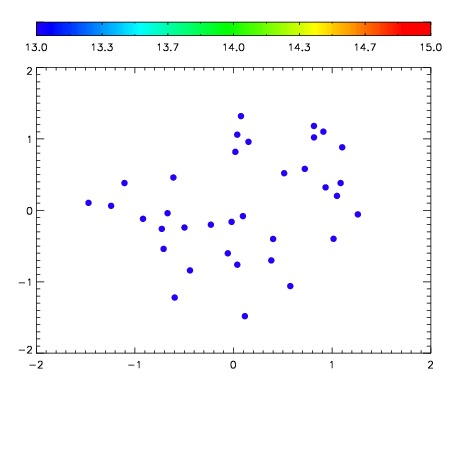

| Frame | Nreads | Zeropoints | Mag plots | Spatial mag deviation | Spatial sky 16325A emission deviations (filled: sky, open: star) | Spatial sky continuum emission | Spatial sky telluric CO2 absorption deviations (filled: H < 10) | |||||||||||||||||||||||
| 0 | 0 |
|
|
|
|
|
|
| IPAIR | NAME | SHIFT | NEWSHIFT | S/N | NAME | SHIFT | NEWSHIFT | S/N |
| 0 | 09780031 | 0.513511 | 0.00000 | 141.244 | 09780029 | 0.00176675 | 0.511744 | 140.798 |
| 1 | 09780030 | 0.513324 | 0.000186980 | 150.595 | 09780032 | 0.00168738 | 0.511824 | 150.370 |
| 2 | 09780027 | 0.513376 | 0.000135005 | 144.808 | 09780028 | 0.00183898 | 0.511672 | 144.003 |
| 3 | 09780026 | 0.512667 | 0.000844002 | 141.110 | 09780025 | 0.00000 | 0.513511 | 134.891 |