| Red | Green | Blue | |
| z | 17.64 | ||
| znorm | Inf | ||
| sky | -Inf | -Inf | -Inf |
| S/N | 27.0 | 44.5 | 46.8 |
| S/N(c) | 0.0 | 0.0 | 0.0 |
| SN(E/C) |
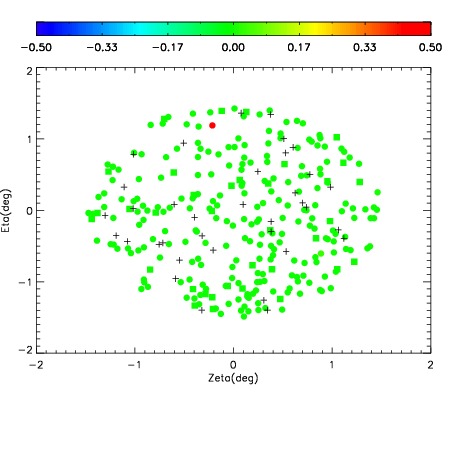
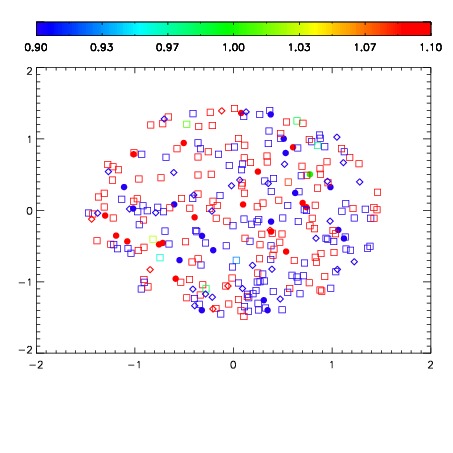
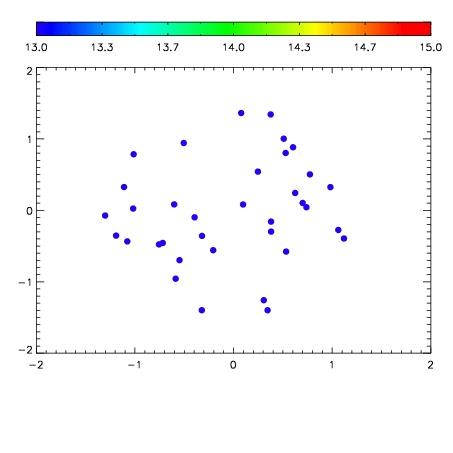

| Frame | Nreads | Zeropoints | Mag plots | Spatial mag deviation | Spatial sky 16325A emission deviations (filled: sky, open: star) | Spatial sky continuum emission | Spatial sky telluric CO2 absorption deviations (filled: H < 10) | |||||||||||||||||||||||
| 0 | 0 |
|
|
|
|
|
|
| IPAIR | NAME | SHIFT | NEWSHIFT | S/N | NAME | SHIFT | NEWSHIFT | S/N |
| 0 | 10080012 | 0.472631 | 0.00000 | 222.870 | 10080017 | 0.000388262 | 0.472243 | 228.634 |
| 1 | 10080011 | 0.472440 | 0.000191003 | 219.851 | 10080014 | 0.00279743 | 0.469834 | 220.742 |
| 2 | 10080015 | 0.472498 | 0.000133008 | 218.775 | 10080013 | 0.00260189 | 0.470029 | 218.181 |
| 3 | 10080016 | 0.471963 | 0.000668019 | 218.010 | 10080010 | 0.00000 | 0.472631 | 210.374 |