| Red | Green | Blue | |
| z | 17.64 | ||
| znorm | Inf | ||
| sky | -Inf | -Inf | -Inf |
| S/N | 29.4 | 47.1 | 51.2 |
| S/N(c) | 0.0 | 0.0 | 0.0 |
| SN(E/C) |
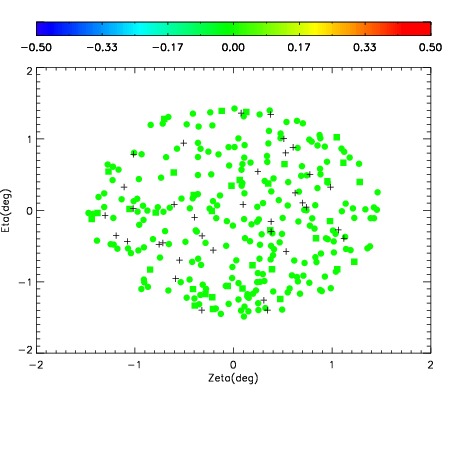
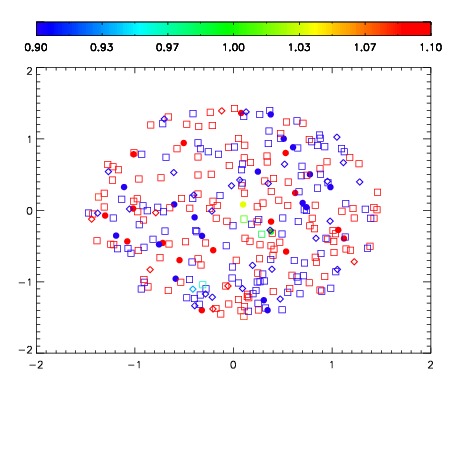
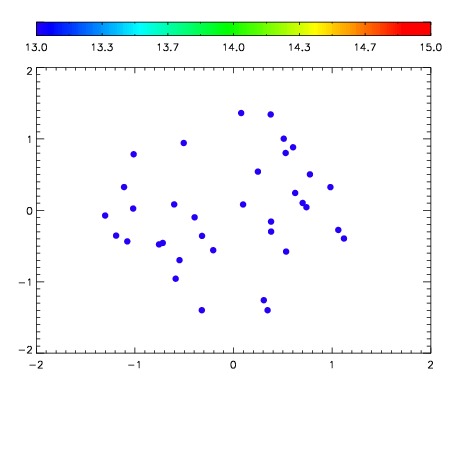

| Frame | Nreads | Zeropoints | Mag plots | Spatial mag deviation | Spatial sky 16325A emission deviations (filled: sky, open: star) | Spatial sky continuum emission | Spatial sky telluric CO2 absorption deviations (filled: H < 10) | |||||||||||||||||||||||
| 0 | 0 |
|
|
|
|
|
|
| IPAIR | NAME | SHIFT | NEWSHIFT | S/N | NAME | SHIFT | NEWSHIFT | S/N |
| 0 | 10120016 | 0.495334 | 0.00000 | 205.069 | 10120014 | 0.00173455 | 0.493599 | 198.654 |
| 1 | 10120012 | 0.494326 | 0.00100800 | 213.900 | 10120010 | 0.00000 | 0.495334 | 211.960 |
| 2 | 10120011 | 0.494713 | 0.000620991 | 212.759 | 10120017 | 0.000674467 | 0.494660 | 206.776 |
| 3 | 10120015 | 0.494614 | 0.000719994 | 207.421 | 10120013 | 0.00122703 | 0.494107 | 202.966 |