| Red | Green | Blue | |
| z | 17.64 | ||
| znorm | Inf | ||
| sky | -Inf | -Inf | -Inf |
| S/N | 20.3 | 32.1 | 37.5 |
| S/N(c) | 0.0 | 0.0 | 0.0 |
| SN(E/C) |
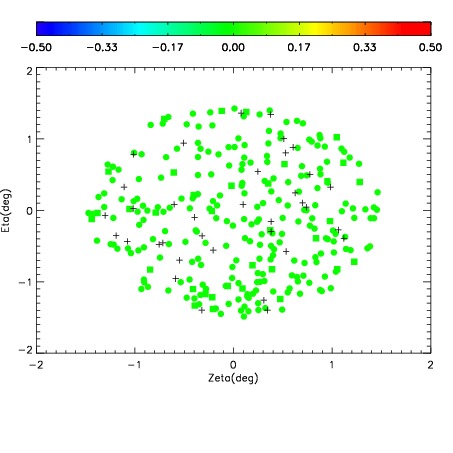
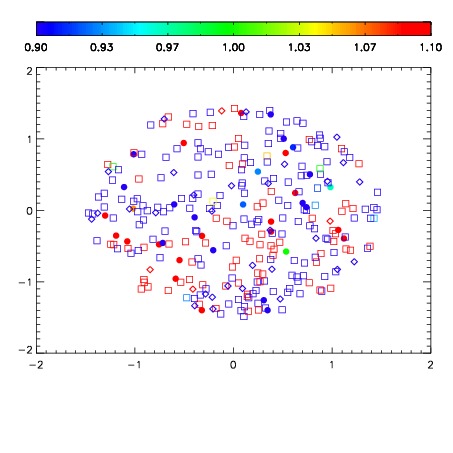
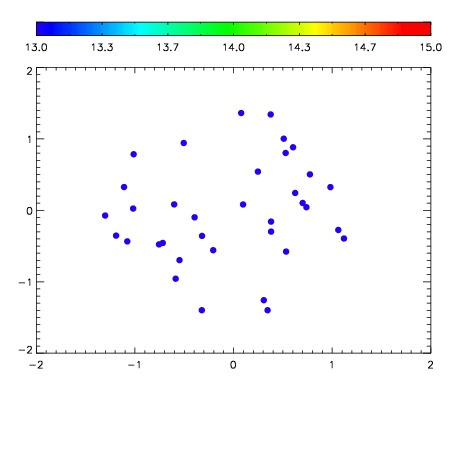

| Frame | Nreads | Zeropoints | Mag plots | Spatial mag deviation | Spatial sky 16325A emission deviations (filled: sky, open: star) | Spatial sky continuum emission | Spatial sky telluric CO2 absorption deviations (filled: H < 10) | |||||||||||||||||||||||
| 0 | 0 |
|
|
|
|
|
|
| IPAIR | NAME | SHIFT | NEWSHIFT | S/N | NAME | SHIFT | NEWSHIFT | S/N |
| 0 | 12460028 | 0.495181 | 0.00000 | 167.935 | 12460027 | 0.00000 | 0.495181 | 200.710 |
| 1 | 12460032 | 0.491303 | 0.00387800 | 244.442 | 12460030 | -0.00111525 | 0.496296 | 247.737 |
| 2 | 12460029 | 0.493973 | 0.00120801 | 227.435 | 12460031 | -0.000615473 | 0.495796 | 221.699 |