| Red | Green | Blue | |
| z | 17.64 | ||
| znorm | Inf | ||
| sky | -NaN | -NaN | -Inf |
| S/N | 28.8 | 46.0 | 50.9 |
| S/N(c) | 0.0 | 0.0 | 0.0 |
| SN(E/C) |

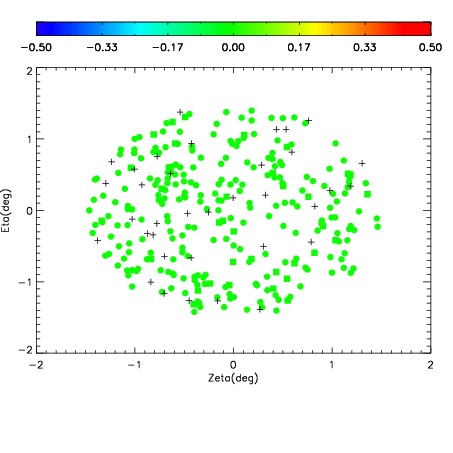
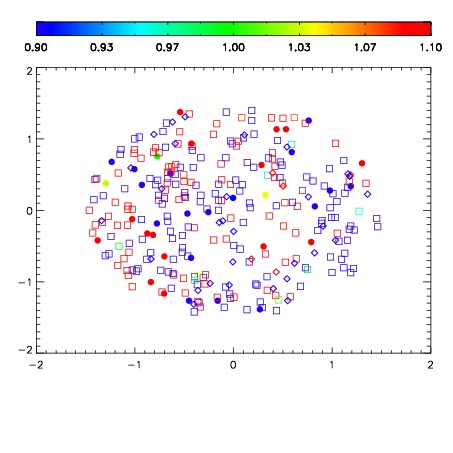
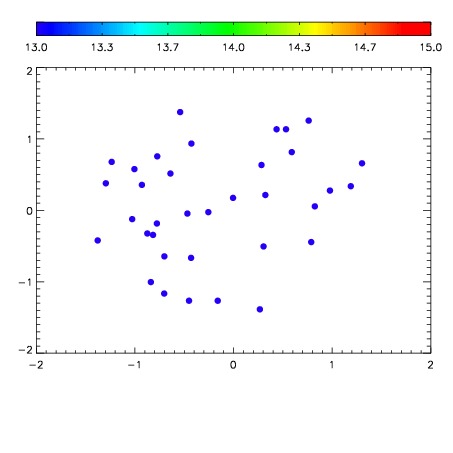

| Frame | Nreads | Zeropoints | Mag plots | Spatial mag deviation | Spatial sky 16325A emission deviations (filled: sky, open: star) | Spatial sky continuum emission | Spatial sky telluric CO2 absorption deviations (filled: H < 10) | |||||||||||||||||||||||
| 0 | 0 |
|
|
|
|
|
|
| IPAIR | NAME | SHIFT | NEWSHIFT | S/N | NAME | SHIFT | NEWSHIFT | S/N |
| 0 | 10050012 | 0.473522 | 0.00000 | 225.243 | 10050018 | -0.00106506 | 0.474587 | 231.311 |
| 1 | 10050016 | 0.472563 | 0.000959009 | 223.980 | 10050011 | 0.00000 | 0.473522 | 222.286 |
| 2 | 10050013 | 0.472979 | 0.000542998 | 221.532 | 10050015 | 0.000955239 | 0.472567 | 216.486 |
| 3 | 10050017 | 0.473136 | 0.000386000 | 219.934 | 10050014 | 0.00103907 | 0.472483 | 215.289 |