| Red | Green | Blue | |
| z | 17.64 | ||
| znorm | Inf | ||
| sky | -NaN | -Inf | -Inf |
| S/N | 22.4 | 40.0 | 40.7 |
| S/N(c) | 0.0 | 0.0 | 0.0 |
| SN(E/C) |

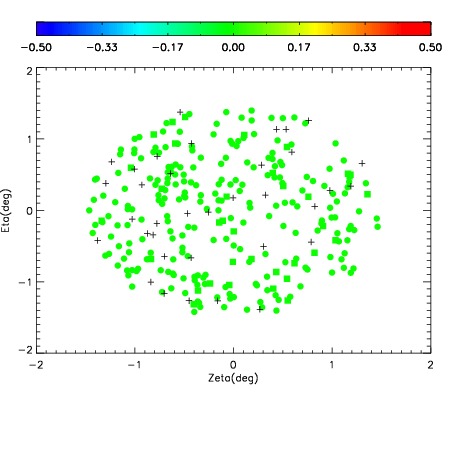
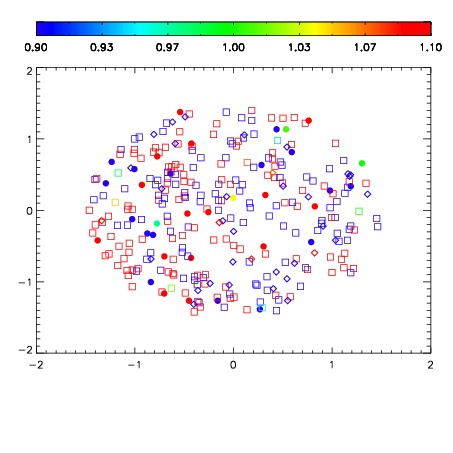
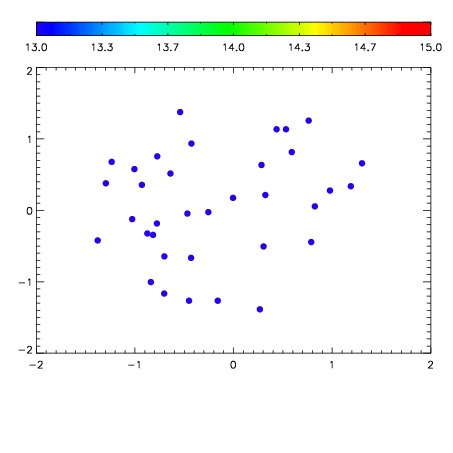

| Frame | Nreads | Zeropoints | Mag plots | Spatial mag deviation | Spatial sky 16325A emission deviations (filled: sky, open: star) | Spatial sky continuum emission | Spatial sky telluric CO2 absorption deviations (filled: H < 10) | |||||||||||||||||||||||
| 0 | 0 |
|
|
|
|
|
|
| IPAIR | NAME | SHIFT | NEWSHIFT | S/N | NAME | SHIFT | NEWSHIFT | S/N |
| 0 | 10090018 | 0.473757 | 0.00000 | 182.071 | 10090019 | 0.00434878 | 0.469408 | 166.172 |
| 1 | 10090017 | 0.472978 | 0.000779003 | 194.012 | 10090012 | 0.00000 | 0.473757 | 201.572 |
| 2 | 10090013 | 0.470809 | 0.00294799 | 188.873 | 10090015 | 0.00125716 | 0.472500 | 196.546 |
| 3 | 10090014 | 0.472055 | 0.00170201 | 184.897 | 10090016 | 0.00177271 | 0.471984 | 190.022 |