| Red | Green | Blue | |
| z | 17.64 | ||
| znorm | Inf | ||
| sky | -Inf | -Inf | -Inf |
| S/N | 12.1 | 22.0 | 23.8 |
| S/N(c) | 0.0 | 0.0 | 0.0 |
| SN(E/C) |
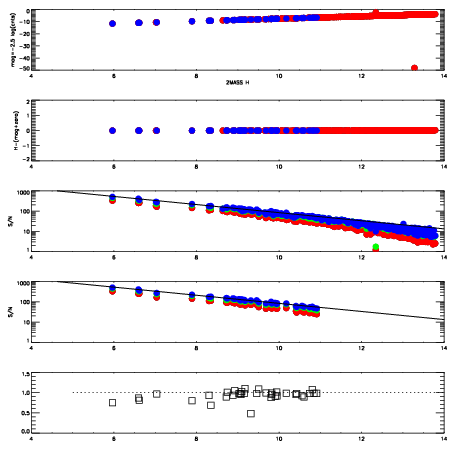
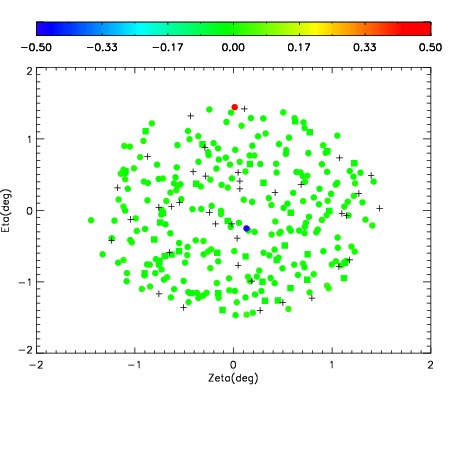

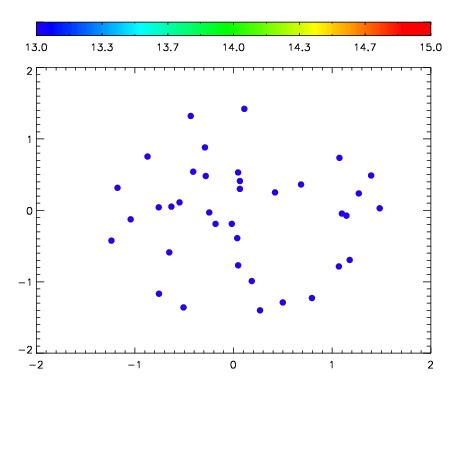

| Frame | Nreads | Zeropoints | Mag plots | Spatial mag deviation | Spatial sky 16325A emission deviations (filled: sky, open: star) | Spatial sky continuum emission | Spatial sky telluric CO2 absorption deviations (filled: H < 10) | |||||||||||||||||||||||
| 0 | 0 |
|
|
|
|
|
|
| IPAIR | NAME | SHIFT | NEWSHIFT | S/N | NAME | SHIFT | NEWSHIFT | S/N |
| 0 | 12290059 | 0.497238 | 0.00000 | 139.335 | 12290057 | 0.00000 | 0.497238 | 132.318 |
| 1 | 12290058 | 0.496915 | 0.000322998 | 141.806 | 12290060 | -0.00113857 | 0.498377 | 140.541 |