| Red | Green | Blue | |
| z | 17.65 | ||
| znorm | Inf | ||
| sky | -Inf | -Inf | -Inf |
| S/N | 6.6 | 11.6 | 13.6 |
| S/N(c) | 0.0 | 0.0 | 0.0 |
| SN(E/C) |
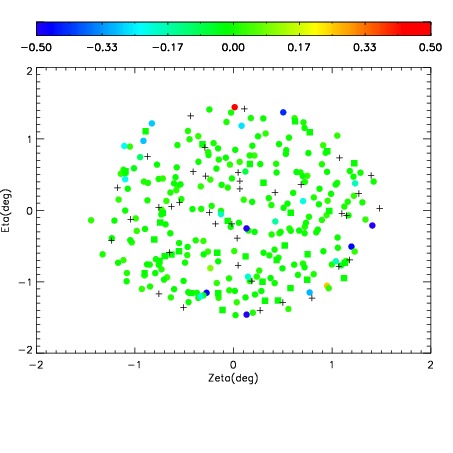
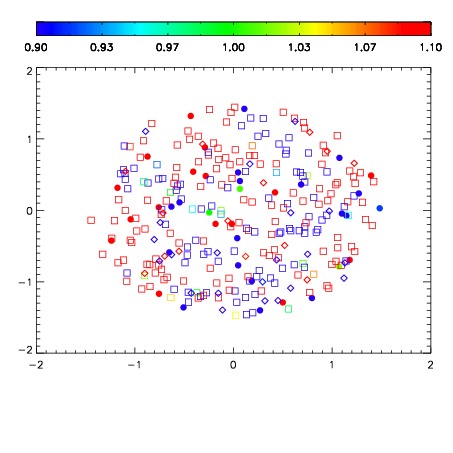
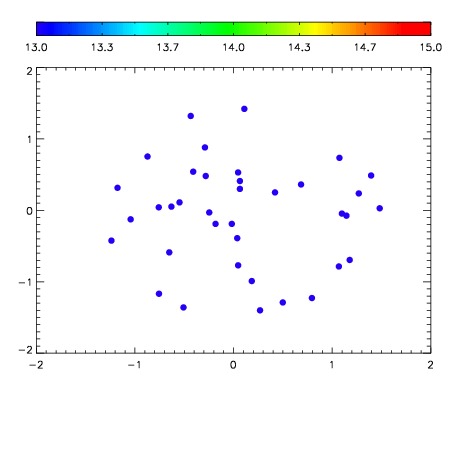

| Frame | Nreads | Zeropoints | Mag plots | Spatial mag deviation | Spatial sky 16325A emission deviations (filled: sky, open: star) | Spatial sky continuum emission | Spatial sky telluric CO2 absorption deviations (filled: H < 10) | |||||||||||||||||||||||
| 0 | 0 |
|
|
|
|
|
|
| IPAIR | NAME | SHIFT | NEWSHIFT | S/N | NAME | SHIFT | NEWSHIFT | S/N |
| 0 | 12340037 | 0.496497 | 0.00000 | 33.2573 | 12340035 | 0.00106935 | 0.495428 | 72.8696 |
| 1 | 12340033 | 0.496354 | 0.000142992 | 97.3589 | 12340031 | 0.00000 | 0.496497 | 106.908 |
| 2 | 12340032 | 0.495970 | 0.000526994 | 93.1793 | 12340034 | 0.00104974 | 0.495447 | 103.266 |