| Red | Green | Blue | |
| z | 17.64 | ||
| znorm | Inf | ||
| sky | -Inf | -Inf | -Inf |
| S/N | 25.7 | 43.7 | 44.7 |
| S/N(c) | 0.0 | 0.0 | 0.0 |
| SN(E/C) |
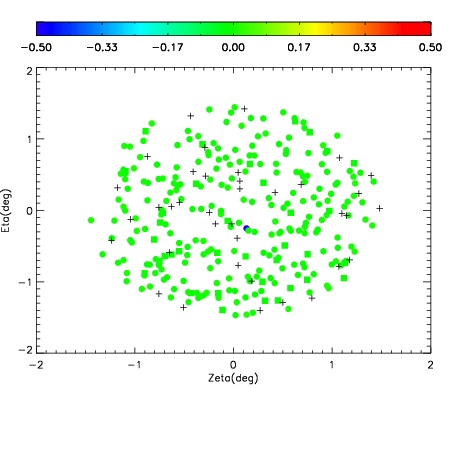
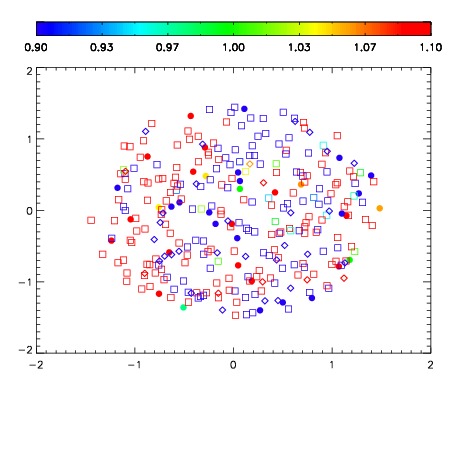
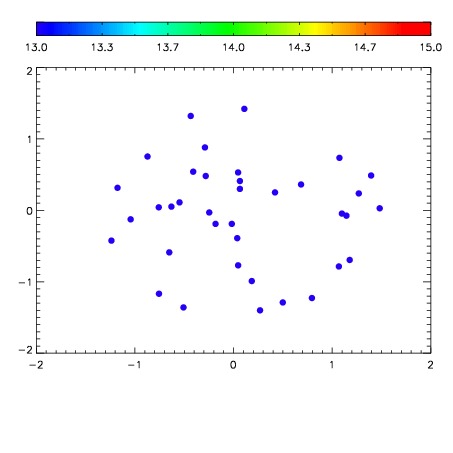

| Frame | Nreads | Zeropoints | Mag plots | Spatial mag deviation | Spatial sky 16325A emission deviations (filled: sky, open: star) | Spatial sky continuum emission | Spatial sky telluric CO2 absorption deviations (filled: H < 10) | |||||||||||||||||||||||
| 0 | 0 |
|
|
|
|
|
|
| IPAIR | NAME | SHIFT | NEWSHIFT | S/N | NAME | SHIFT | NEWSHIFT | S/N |
| 0 | 12440024 | 0.491695 | 0.00000 | 188.857 | 12440025 | -0.00167379 | 0.493369 | 193.773 |
| 1 | 12440028 | 0.490134 | 0.00156099 | 198.792 | 12440029 | -0.00190019 | 0.493595 | 199.637 |
| 2 | 12440023 | 0.491253 | 0.000441998 | 183.172 | 12440026 | -0.000970861 | 0.492666 | 187.191 |
| 3 | 12440027 | 0.490465 | 0.00123000 | 181.526 | 12440022 | 0.00000 | 0.491695 | 155.992 |