| Red | Green | Blue | |
| z | 17.64 | ||
| znorm | Inf | ||
| sky | -Inf | -Inf | -Inf |
| S/N | 6.6 | 13.8 | 17.5 |
| S/N(c) | 0.0 | 0.0 | 0.0 |
| SN(E/C) |
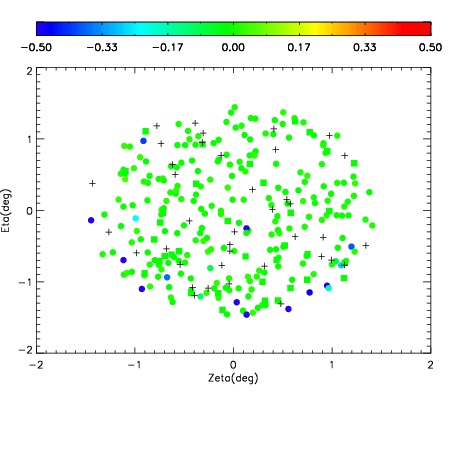
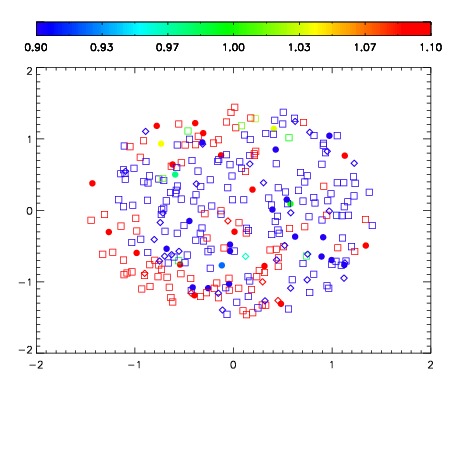
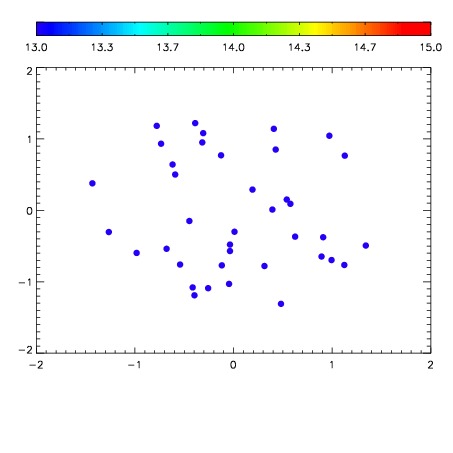

| Frame | Nreads | Zeropoints | Mag plots | Spatial mag deviation | Spatial sky 16325A emission deviations (filled: sky, open: star) | Spatial sky continuum emission | Spatial sky telluric CO2 absorption deviations (filled: H < 10) | |||||||||||||||||||||||
| 0 | 0 |
|
|
|
|
|
|
| IPAIR | NAME | SHIFT | NEWSHIFT | S/N | NAME | SHIFT | NEWSHIFT | S/N |
| 0 | 12260072 | 0.490800 | 0.00000 | 89.8967 | 12260070 | 0.00000 | 0.490800 | 91.8666 |
| 1 | 12260075 | 0.488631 | 0.00216898 | 92.4678 | 12260074 | -0.00567822 | 0.496478 | 92.7203 |
| 2 | 12260071 | 0.488739 | 0.00206098 | 91.4747 | 12260073 | -0.00569134 | 0.496491 | 92.3816 |