| Red | Green | Blue | |
| z | 17.64 | ||
| znorm | Inf | ||
| sky | -Inf | -Inf | -Inf |
| S/N | 12.6 | 20.9 | 23.2 |
| S/N(c) | 0.0 | 0.0 | 0.0 |
| SN(E/C) |

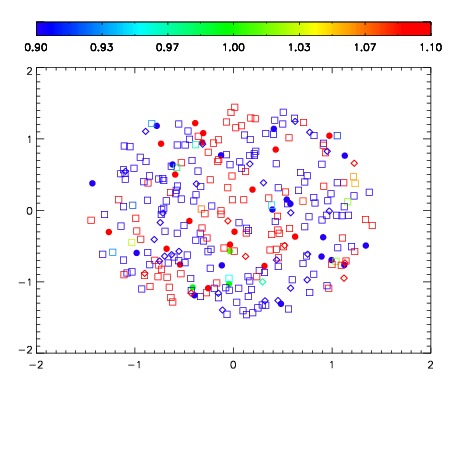
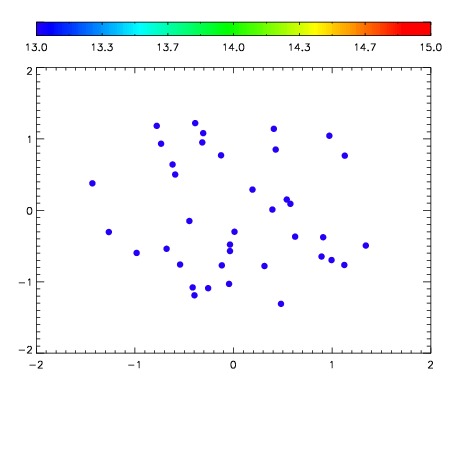

| Frame | Nreads | Zeropoints | Mag plots | Spatial mag deviation | Spatial sky 16325A emission deviations (filled: sky, open: star) | Spatial sky continuum emission | Spatial sky telluric CO2 absorption deviations (filled: H < 10) | |||||||||||||||||||||||
| 0 | 0 |
|
|
|
|
|
|
| IPAIR | NAME | SHIFT | NEWSHIFT | S/N | NAME | SHIFT | NEWSHIFT | S/N |
| 0 | 12330035 | 0.497121 | 0.00000 | 68.1976 | 12330036 | 0.000286274 | 0.496835 | 28.8173 |
| 1 | 12330039 | 0.496766 | 0.000355005 | 131.491 | 12330040 | -0.00167904 | 0.498800 | 165.748 |
| 2 | 12330038 | 0.496090 | 0.00103101 | 90.0587 | 12330033 | 0.00000 | 0.497121 | 33.5870 |
| 3 | 12330034 | 0.496631 | 0.000490010 | 70.7429 | 12330037 | 0.000622026 | 0.496499 | 33.1750 |