| Red | Green | Blue | |
| z | 17.64 | ||
| znorm | Inf | ||
| sky | -Inf | -Inf | -Inf |
| S/N | 22.3 | 35.1 | 38.9 |
| S/N(c) | 0.0 | 0.0 | 0.0 |
| SN(E/C) |
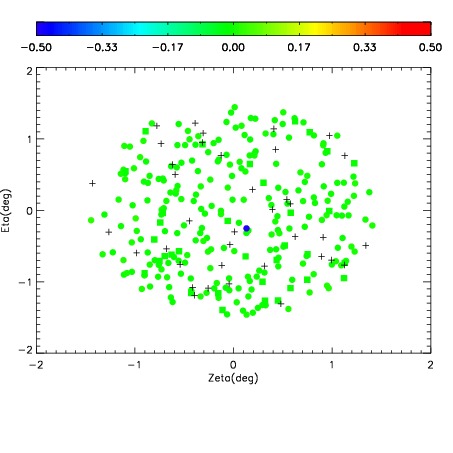
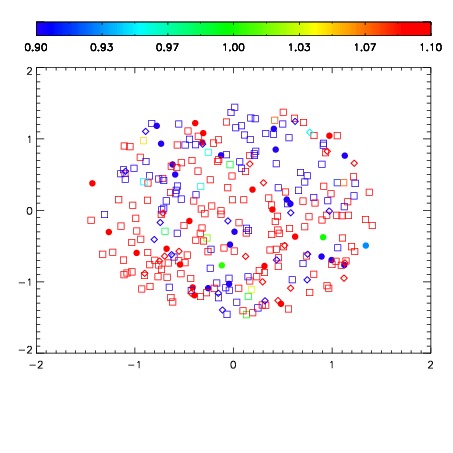
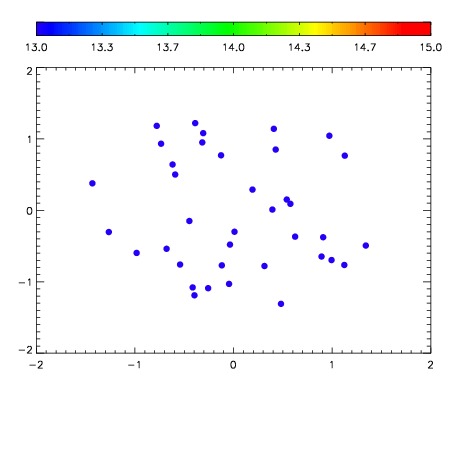

| Frame | Nreads | Zeropoints | Mag plots | Spatial mag deviation | Spatial sky 16325A emission deviations (filled: sky, open: star) | Spatial sky continuum emission | Spatial sky telluric CO2 absorption deviations (filled: H < 10) | |||||||||||||||||||||||
| 0 | 0 |
|
|
|
|
|
|
| IPAIR | NAME | SHIFT | NEWSHIFT | S/N | NAME | SHIFT | NEWSHIFT | S/N |
| 0 | 12400017 | 0.493188 | 0.00000 | 179.067 | 12400022 | -0.00404609 | 0.497234 | 177.162 |
| 1 | 12400020 | 0.491558 | 0.00163001 | 187.040 | 12400018 | -0.000316145 | 0.493504 | 192.382 |
| 2 | 12400021 | 0.492134 | 0.00105399 | 186.640 | 12400019 | 0.000629287 | 0.492559 | 184.327 |
| 3 | 12400016 | 0.492691 | 0.000496984 | 166.903 | 12400015 | 0.00000 | 0.493188 | 155.250 |