| Red | Green | Blue | |
| z | 17.64 | ||
| znorm | Inf | ||
| sky | -NaN | -Inf | -Inf |
| S/N | 28.7 | 50.6 | 54.3 |
| S/N(c) | 0.0 | 0.0 | 0.0 |
| SN(E/C) |

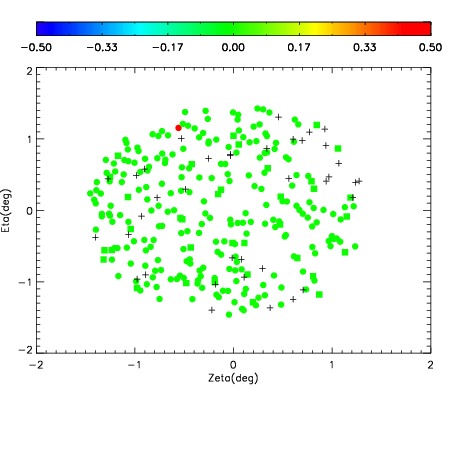
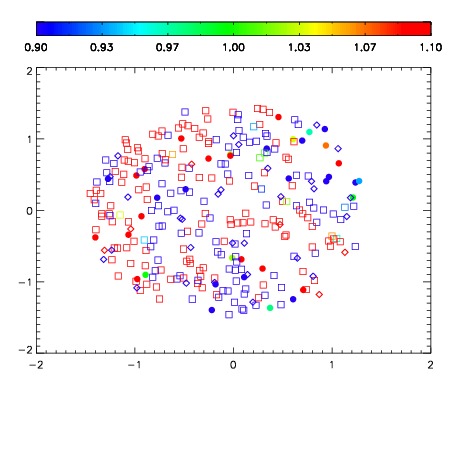


| Frame | Nreads | Zeropoints | Mag plots | Spatial mag deviation | Spatial sky 16325A emission deviations (filled: sky, open: star) | Spatial sky continuum emission | Spatial sky telluric CO2 absorption deviations (filled: H < 10) | |||||||||||||||||||||||
| 0 | 0 |
|
|
|
|
|
|
| IPAIR | NAME | SHIFT | NEWSHIFT | S/N | NAME | SHIFT | NEWSHIFT | S/N |
| 0 | 12480035 | 0.496410 | 0.00000 | 182.022 | 12480033 | 0.00000 | 0.496410 | 180.386 |
| 1 | 12480034 | 0.495299 | 0.00111100 | 183.081 | 12480037 | 0.000388678 | 0.496021 | 182.487 |
| 2 | 12480038 | 0.494947 | 0.00146303 | 179.986 | 12480036 | -0.000569514 | 0.496980 | 179.986 |
| 3 | 12480039 | 0.494853 | 0.00155702 | 173.708 | 12480040 | 0.00197993 | 0.494430 | 177.145 |