| Red | Green | Blue | |
| z | 17.64 | ||
| znorm | Inf | ||
| sky | -Inf | -Inf | -Inf |
| S/N | 21.3 | 36.2 | 37.5 |
| S/N(c) | 0.0 | 0.0 | 0.0 |
| SN(E/C) |
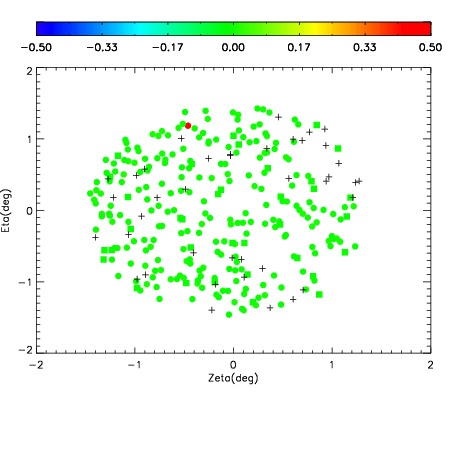
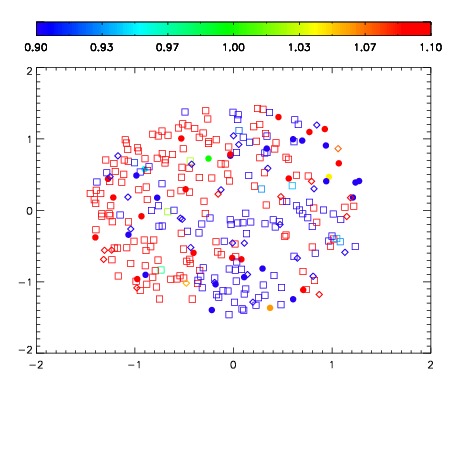
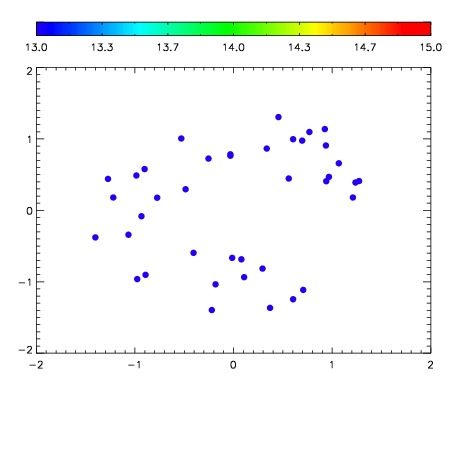

| Frame | Nreads | Zeropoints | Mag plots | Spatial mag deviation | Spatial sky 16325A emission deviations (filled: sky, open: star) | Spatial sky continuum emission | Spatial sky telluric CO2 absorption deviations (filled: H < 10) | |||||||||||||||||||||||
| 0 | 0 |
|
|
|
|
|
|
| IPAIR | NAME | SHIFT | NEWSHIFT | S/N | NAME | SHIFT | NEWSHIFT | S/N |
| 0 | 12630024 | 0.485295 | 0.00000 | 144.529 | 12630026 | -0.00239203 | 0.487687 | 175.496 |
| 1 | 12630023 | 0.484217 | 0.00107801 | 173.964 | 12630022 | 0.00000 | 0.485295 | 178.591 |
| 2 | 12630028 | 0.484452 | 0.000842988 | 137.384 | 12630025 | -0.00242471 | 0.487720 | 171.966 |
| 3 | 12630027 | 0.484276 | 0.00101900 | 103.771 | 12630029 | -0.00202456 | 0.487320 | 156.575 |