| Red | Green | Blue | |
| z | 17.64 | ||
| znorm | Inf | ||
| sky | -Inf | -Inf | -Inf |
| S/N | 27.2 | 47.5 | 50.7 |
| S/N(c) | 0.0 | 0.0 | 0.0 |
| SN(E/C) |
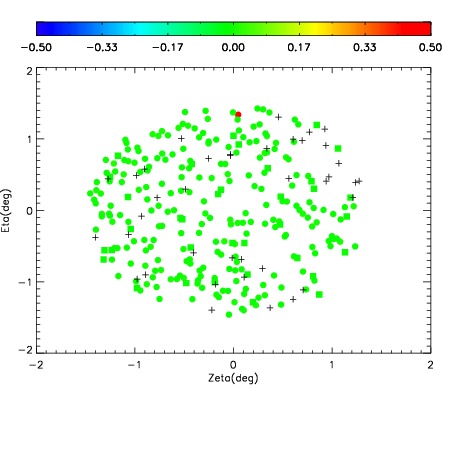
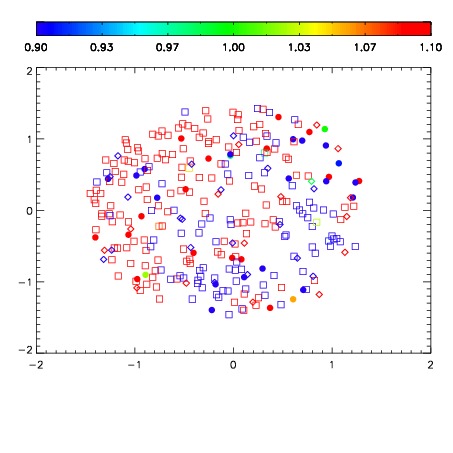


| Frame | Nreads | Zeropoints | Mag plots | Spatial mag deviation | Spatial sky 16325A emission deviations (filled: sky, open: star) | Spatial sky continuum emission | Spatial sky telluric CO2 absorption deviations (filled: H < 10) | |||||||||||||||||||||||
| 0 | 0 |
|
|
|
|
|
|
| IPAIR | NAME | SHIFT | NEWSHIFT | S/N | NAME | SHIFT | NEWSHIFT | S/N |
| 0 | 12680054 | 0.492112 | 0.00000 | 135.967 | 12680055 | 0.00342235 | 0.488690 | 161.414 |
| 1 | 12680049 | 0.489002 | 0.00311002 | 176.075 | 12680052 | 0.00182269 | 0.490289 | 176.935 |
| 2 | 12680053 | 0.491330 | 0.000782013 | 174.484 | 12680048 | 0.00000 | 0.492112 | 175.703 |
| 3 | 12680050 | 0.490126 | 0.00198600 | 172.018 | 12680051 | 0.00171597 | 0.490396 | 171.285 |