| Red | Green | Blue | |
| z | 17.64 | ||
| znorm | Inf | ||
| sky | -Inf | -Inf | -Inf |
| S/N | 24.2 | 42.0 | 45.5 |
| S/N(c) | 0.0 | 0.0 | 0.0 |
| SN(E/C) |

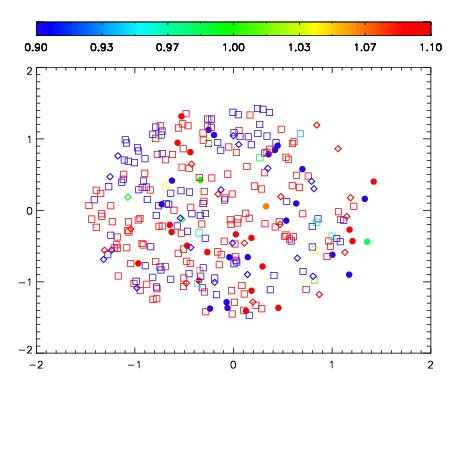
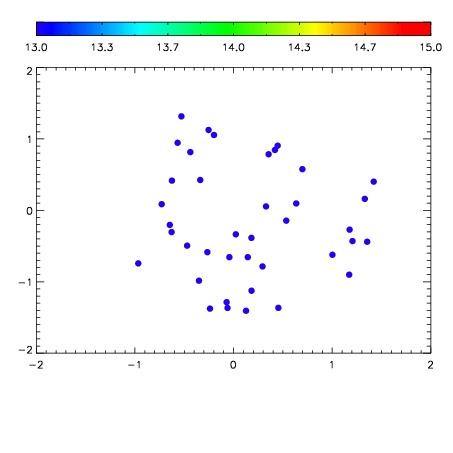

| Frame | Nreads | Zeropoints | Mag plots | Spatial mag deviation | Spatial sky 16325A emission deviations (filled: sky, open: star) | Spatial sky continuum emission | Spatial sky telluric CO2 absorption deviations (filled: H < 10) | |||||||||||||||||||||||
| 0 | 0 |
|
|
|
|
|
|
| IPAIR | NAME | SHIFT | NEWSHIFT | S/N | NAME | SHIFT | NEWSHIFT | S/N |
| 0 | 12620039 | 0.486851 | 0.00000 | 171.158 | 12620040 | 0.00249104 | 0.484360 | 168.549 |
| 1 | 12620038 | 0.486428 | 0.000423014 | 167.190 | 12620036 | 0.000631792 | 0.486219 | 165.054 |
| 2 | 12620035 | 0.485514 | 0.00133702 | 158.503 | 12620037 | 0.00124959 | 0.485601 | 159.397 |
| 3 | 12620034 | 0.485887 | 0.000964016 | 151.821 | 12620033 | 0.00000 | 0.486851 | 141.768 |