| Red | Green | Blue | |
| z | 17.64 | ||
| znorm | Inf | ||
| sky | -Inf | -Inf | -Inf |
| S/N | 22.6 | 39.8 | 42.2 |
| S/N(c) | 0.0 | 0.0 | 0.0 |
| SN(E/C) |
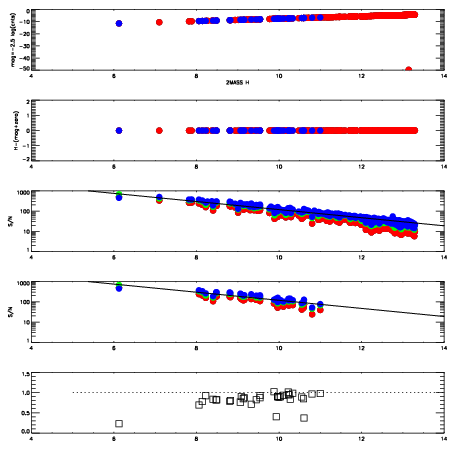
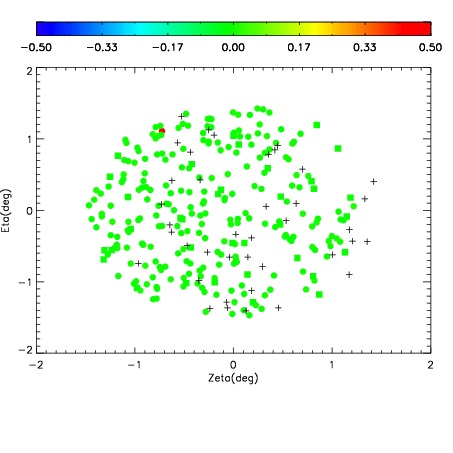
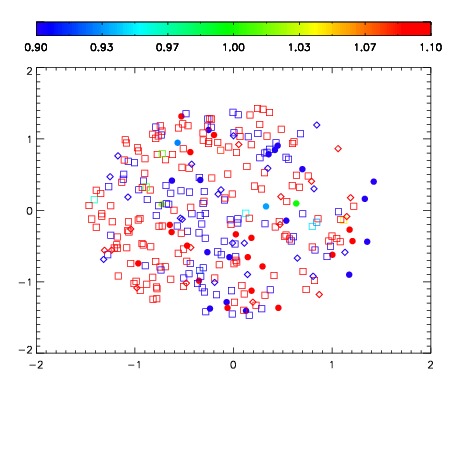
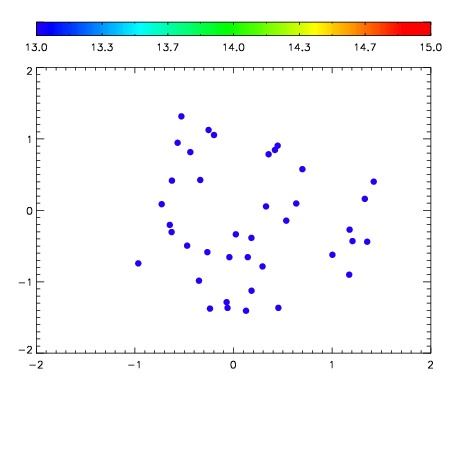

| Frame | Nreads | Zeropoints | Mag plots | Spatial mag deviation | Spatial sky 16325A emission deviations (filled: sky, open: star) | Spatial sky continuum emission | Spatial sky telluric CO2 absorption deviations (filled: H < 10) | |||||||||||||||||||||||
| 0 | 0 |
|
|
|
|
|
|
| IPAIR | NAME | SHIFT | NEWSHIFT | S/N | NAME | SHIFT | NEWSHIFT | S/N |
| 0 | 12680043 | 0.488648 | 0.00000 | 183.813 | 12680044 | -0.00224791 | 0.490896 | 182.767 |
| 1 | 12680042 | 0.488247 | 0.000400990 | 183.436 | 12680041 | -0.00120847 | 0.489856 | 179.584 |
| 2 | 12680039 | 0.488646 | 1.99676e-06 | 168.384 | 12680040 | -0.00105882 | 0.489707 | 170.846 |
| 3 | 12680038 | 0.488417 | 0.000230998 | 141.546 | 12680037 | 0.00000 | 0.488648 | 115.839 |