| Red | Green | Blue | |
| z | 17.64 | ||
| znorm | Inf | ||
| sky | -Inf | -Inf | -Inf |
| S/N | 19.1 | 34.9 | 35.7 |
| S/N(c) | 0.0 | 0.0 | 0.0 |
| SN(E/C) |
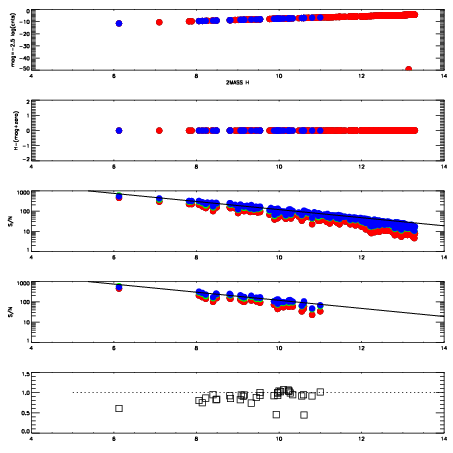
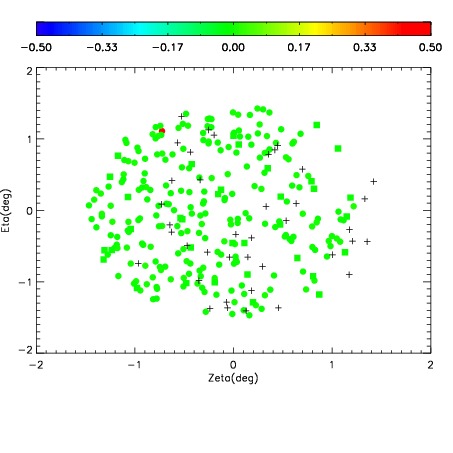
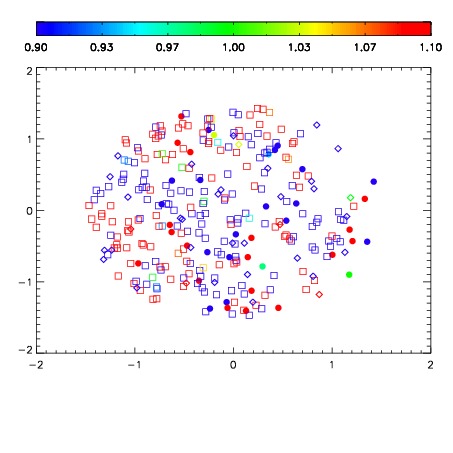
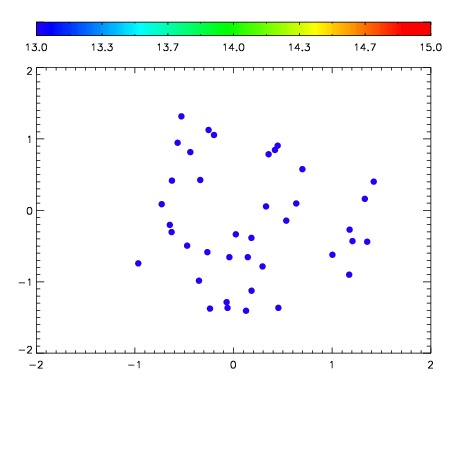

| Frame | Nreads | Zeropoints | Mag plots | Spatial mag deviation | Spatial sky 16325A emission deviations (filled: sky, open: star) | Spatial sky continuum emission | Spatial sky telluric CO2 absorption deviations (filled: H < 10) | |||||||||||||||||||||||
| 0 | 0 |
|
|
|
|
|
|
| IPAIR | NAME | SHIFT | NEWSHIFT | S/N | NAME | SHIFT | NEWSHIFT | S/N |
| 0 | 12690017 | 0.489613 | 0.00000 | 186.281 | 12690018 | 0.00250624 | 0.487107 | 144.135 |
| 1 | 12690013 | 0.487297 | 0.00231600 | 149.072 | 12690011 | 0.00000 | 0.489613 | 140.508 |
| 2 | 12690012 | 0.486741 | 0.00287199 | 142.194 | 12690015 | 0.00111150 | 0.488501 | 135.941 |
| 3 | 12690016 | 0.488943 | 0.000669986 | 131.028 | 12690014 | 0.000525676 | 0.489087 | 110.530 |