| Red | Green | Blue | |
| z | 17.64 | ||
| znorm | Inf | ||
| sky | -Inf | -Inf | -Inf |
| S/N | 27.8 | 47.6 | 50.0 |
| S/N(c) | 0.0 | 0.0 | 0.0 |
| SN(E/C) |
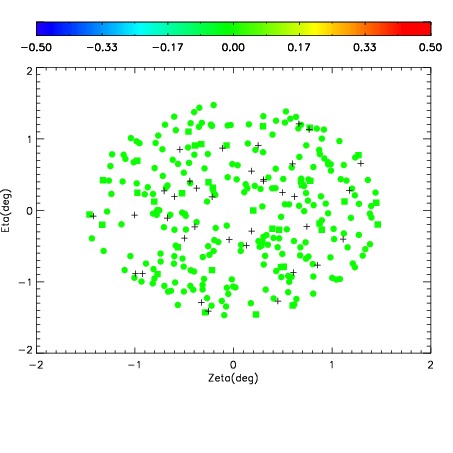
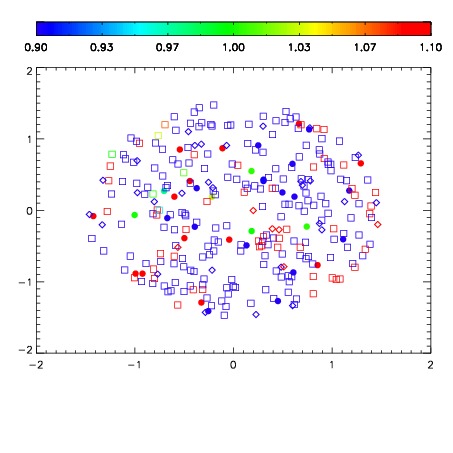
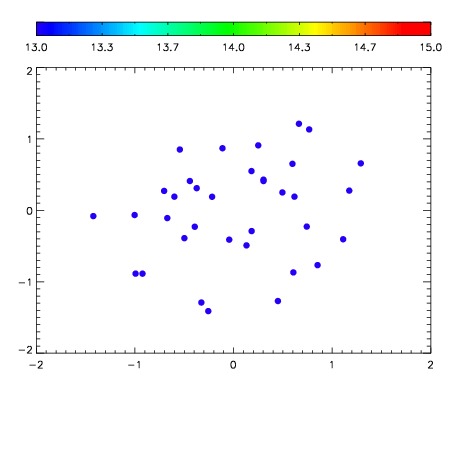

| Frame | Nreads | Zeropoints | Mag plots | Spatial mag deviation | Spatial sky 16325A emission deviations (filled: sky, open: star) | Spatial sky continuum emission | Spatial sky telluric CO2 absorption deviations (filled: H < 10) | |||||||||||||||||||||||
| 0 | 0 |
|
|
|
|
|
|
| IPAIR | NAME | SHIFT | NEWSHIFT | S/N | NAME | SHIFT | NEWSHIFT | S/N |
| 0 | 08720013 | 0.469127 | 0.00000 | 171.122 | 08720011 | 0.00000 | 0.469127 | 169.827 |
| 1 | 08720017 | 0.466922 | 0.00220501 | 177.284 | 08720018 | -0.00258692 | 0.471714 | 174.725 |
| 2 | 08720016 | 0.467068 | 0.00205901 | 173.227 | 08720015 | 0.00106462 | 0.468062 | 172.408 |
| 3 | 08720012 | 0.468788 | 0.000339001 | 169.406 | 08720014 | 0.00136776 | 0.467759 | 169.300 |