| Red | Green | Blue | |
| z | 17.64 | ||
| znorm | Inf | ||
| sky | -Inf | -Inf | -Inf |
| S/N | 22.4 | 41.1 | 43.6 |
| S/N(c) | 0.0 | 0.0 | 0.0 |
| SN(E/C) |

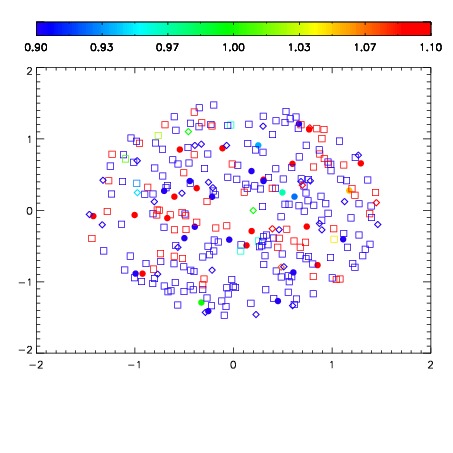
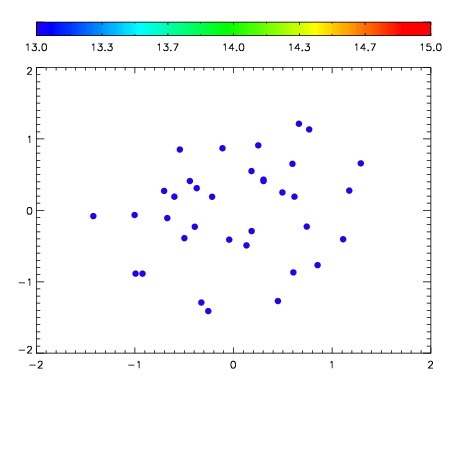

| Frame | Nreads | Zeropoints | Mag plots | Spatial mag deviation | Spatial sky 16325A emission deviations (filled: sky, open: star) | Spatial sky continuum emission | Spatial sky telluric CO2 absorption deviations (filled: H < 10) | |||||||||||||||||||||||
| 0 | 0 |
|
|
|
|
|
|
| IPAIR | NAME | SHIFT | NEWSHIFT | S/N | NAME | SHIFT | NEWSHIFT | S/N |
| 0 | 08800013 | 0.473266 | 0.00000 | 158.086 | 08800015 | -0.000305598 | 0.473572 | 162.992 |
| 1 | 08800016 | 0.471077 | 0.00218901 | 158.952 | 08800018 | -0.000650545 | 0.473917 | 166.856 |
| 2 | 08800017 | 0.470386 | 0.00288001 | 157.639 | 08800014 | -0.000281844 | 0.473548 | 160.862 |
| 3 | 08800012 | 0.473262 | 3.99351e-06 | 148.322 | 08800011 | 0.00000 | 0.473266 | 139.251 |