| Red | Green | Blue | |
| z | 17.64 | ||
| znorm | 13.46 | ||
| sky | 19.9 | 19.4 | 18.5 |
| S/N | 12.9 | 22.3 | 24.6 |
| S/N(c) | 0.0 | 0.0 | 0.0 |
| SN(E/C) |
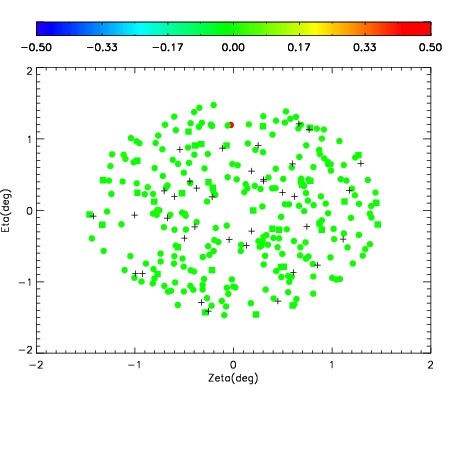
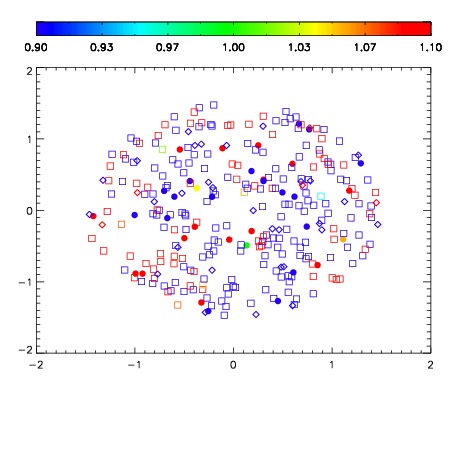
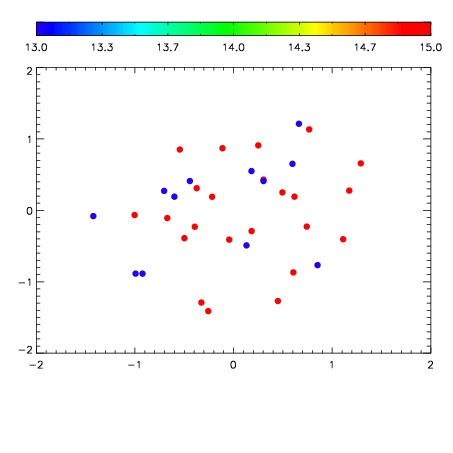

| Frame | Nreads | Zeropoints | Mag plots | Spatial mag deviation | Spatial sky 16325A emission deviations (filled: sky, open: star) | Spatial sky continuum emission | Spatial sky telluric CO2 absorption deviations (filled: H < 10) | |||||||||||||||||||||||
| 0 | 47 |
|
|
|
|
|
|
| IPAIR | NAME | SHIFT | NEWSHIFT | S/N | NAME | SHIFT | NEWSHIFT | S/N |
| 0 | 11600027 | 0.485094 | 0.00000 | 187.741 | 11600026 | 0.00000 | 0.485094 | 189.970 |