| Red | Green | Blue | |
| z | 17.64 | ||
| znorm | Inf | ||
| sky | -NaN | -Inf | -Inf |
| S/N | 29.1 | 47.4 | 51.2 |
| S/N(c) | 0.0 | 0.0 | 0.0 |
| SN(E/C) |
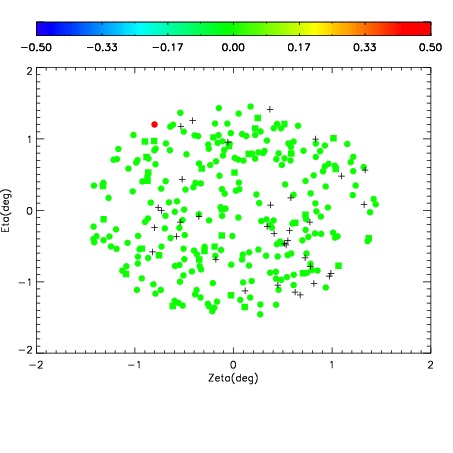
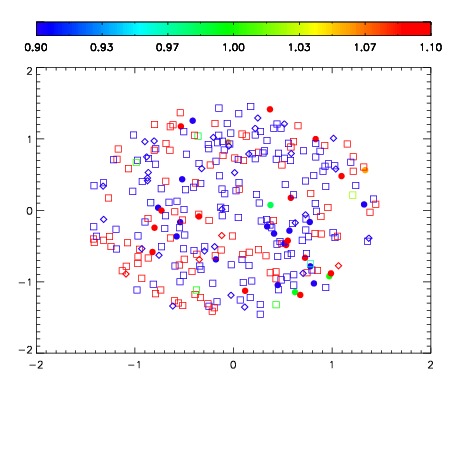
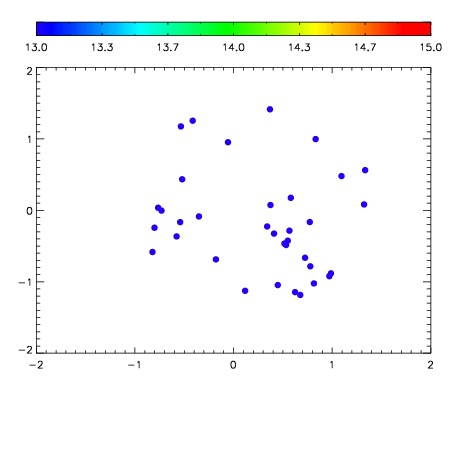

| Frame | Nreads | Zeropoints | Mag plots | Spatial mag deviation | Spatial sky 16325A emission deviations (filled: sky, open: star) | Spatial sky continuum emission | Spatial sky telluric CO2 absorption deviations (filled: H < 10) | |||||||||||||||||||||||
| 0 | 0 |
|
|
|
|
|
|
| IPAIR | NAME | SHIFT | NEWSHIFT | S/N | NAME | SHIFT | NEWSHIFT | S/N |
| 0 | 09070075 | 0.478728 | 0.00000 | 199.099 | 09070069 | 0.00000 | 0.478728 | 199.651 |
| 1 | 09070071 | 0.477912 | 0.000815988 | 203.328 | 09070073 | 0.00363717 | 0.475091 | 202.924 |
| 2 | 09070070 | 0.476514 | 0.00221398 | 201.239 | 09070072 | 0.00438504 | 0.474343 | 202.127 |
| 3 | 09070074 | 0.478086 | 0.000642002 | 198.966 | 09070076 | 0.00153126 | 0.477197 | 197.165 |