| Red | Green | Blue | |
| z | 17.64 | ||
| znorm | Inf | ||
| sky | -NaN | -NaN | -Inf |
| S/N | 31.5 | 51.4 | 53.4 |
| S/N(c) | 0.0 | 0.0 | 0.0 |
| SN(E/C) |
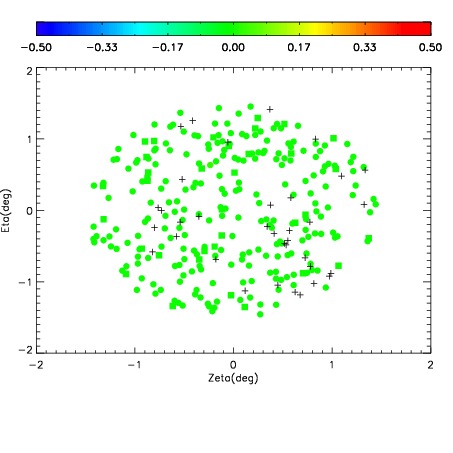

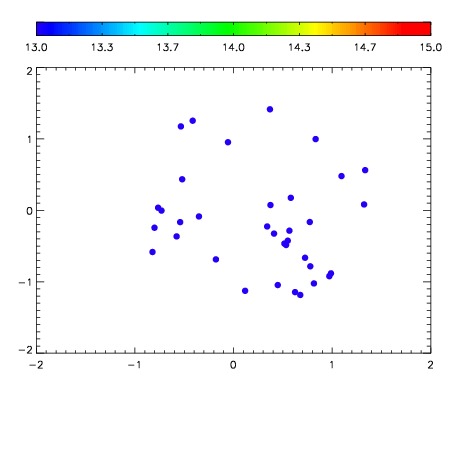

| Frame | Nreads | Zeropoints | Mag plots | Spatial mag deviation | Spatial sky 16325A emission deviations (filled: sky, open: star) | Spatial sky continuum emission | Spatial sky telluric CO2 absorption deviations (filled: H < 10) | |||||||||||||||||||||||
| 0 | 0 |
|
|
|
|
|
|
| IPAIR | NAME | SHIFT | NEWSHIFT | S/N | NAME | SHIFT | NEWSHIFT | S/N |
| 0 | 10270012 | 0.494271 | 0.00000 | 202.005 | 10270018 | 0.00344140 | 0.490830 | 201.358 |
| 1 | 10270017 | 0.494023 | 0.000248015 | 203.110 | 10270015 | 0.00252273 | 0.491748 | 205.554 |
| 2 | 10270016 | 0.493298 | 0.000973016 | 202.954 | 10270014 | 0.00240929 | 0.491862 | 205.127 |
| 3 | 10270013 | 0.493504 | 0.000767022 | 200.806 | 10270011 | 0.00000 | 0.494271 | 200.216 |