| Red | Green | Blue | |
| z | 17.64 | ||
| znorm | Inf | ||
| sky | -NaN | -Inf | -Inf |
| S/N | 27.4 | 45.9 | 48.1 |
| S/N(c) | 0.0 | 0.0 | 0.0 |
| SN(E/C) |
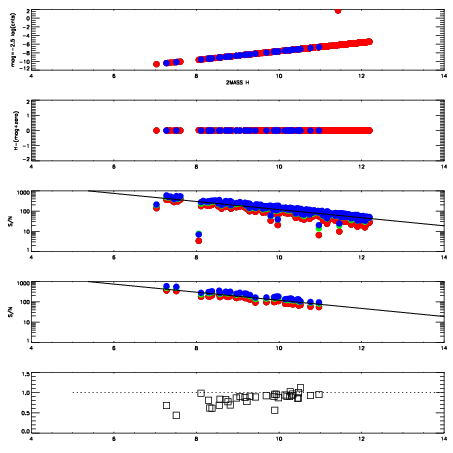
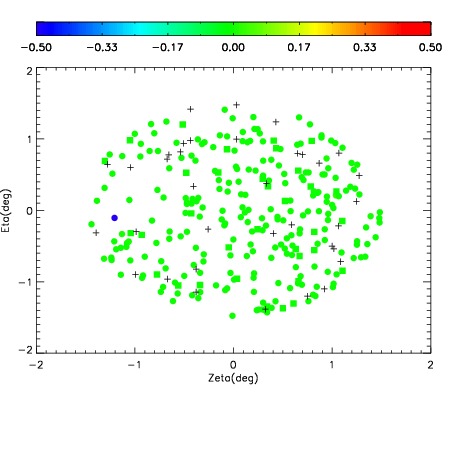
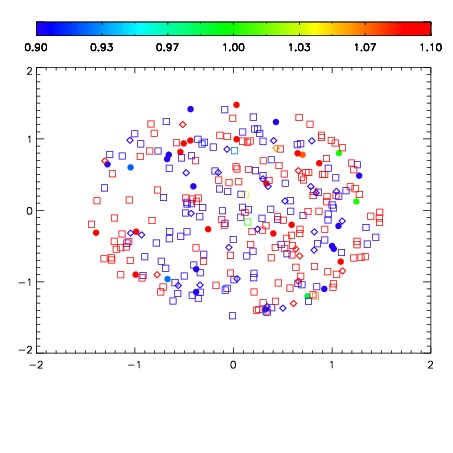


| Frame | Nreads | Zeropoints | Mag plots | Spatial mag deviation | Spatial sky 16325A emission deviations (filled: sky, open: star) | Spatial sky continuum emission | Spatial sky telluric CO2 absorption deviations (filled: H < 10) | |||||||||||||||||||||||
| 0 | 0 |
|
|
|
|
|
|
| IPAIR | NAME | SHIFT | NEWSHIFT | S/N | NAME | SHIFT | NEWSHIFT | S/N |
| 0 | 10410012 | 0.515221 | 0.00000 | 245.647 | 10410011 | 0.00000 | 0.515221 | 239.304 |
| 1 | 10410016 | 0.514355 | 0.000865996 | 246.020 | 10410018 | 0.00268368 | 0.512537 | 249.152 |
| 2 | 10410013 | 0.514828 | 0.000392973 | 244.579 | 10410015 | 0.00181547 | 0.513406 | 238.424 |
| 3 | 10410017 | 0.514902 | 0.000319004 | 241.990 | 10410014 | 0.00216178 | 0.513059 | 235.617 |