| Red | Green | Blue | |
| z | 17.64 | ||
| znorm | Inf | ||
| sky | -Inf | -Inf | -Inf |
| S/N | 29.6 | 49.4 | 52.5 |
| S/N(c) | 0.0 | 0.0 | 0.0 |
| SN(E/C) |
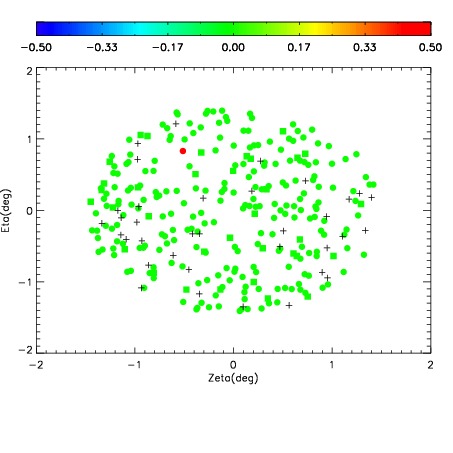
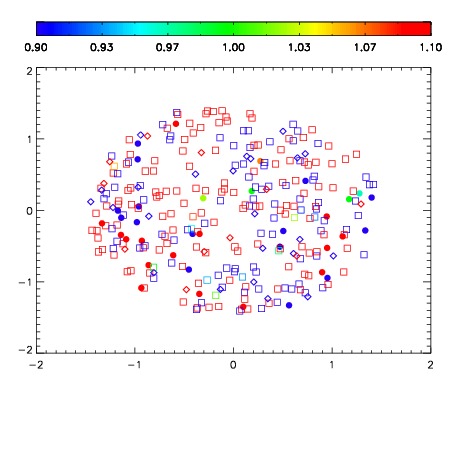
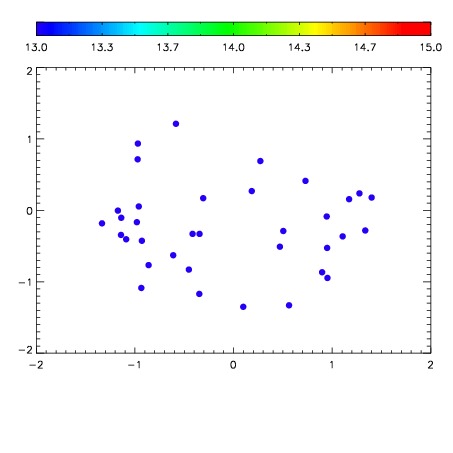

| Frame | Nreads | Zeropoints | Mag plots | Spatial mag deviation | Spatial sky 16325A emission deviations (filled: sky, open: star) | Spatial sky continuum emission | Spatial sky telluric CO2 absorption deviations (filled: H < 10) | |||||||||||||||||||||||
| 0 | 0 |
|
|
|
|
|
|
| IPAIR | NAME | SHIFT | NEWSHIFT | S/N | NAME | SHIFT | NEWSHIFT | S/N |
| 0 | 06700012 | 0.482114 | 0.00000 | 137.264 | 06700013 | 0.00161496 | 0.480499 | 132.798 |
| 1 | 06700011 | 0.481690 | 0.000423998 | 143.731 | 06700010 | 0.00000 | 0.482114 | 148.595 |
| 2 | 06700016 | 0.481388 | 0.000725985 | 142.495 | 06700017 | -9.35474e-06 | 0.482123 | 139.767 |
| 3 | 06700015 | 0.481768 | 0.000345975 | 137.964 | 06700014 | -0.000478033 | 0.482592 | 139.216 |