| Red | Green | Blue | |
| z | 17.64 | ||
| znorm | Inf | ||
| sky | -Inf | -Inf | -Inf |
| S/N | 26.5 | 45.4 | 47.0 |
| S/N(c) | 0.0 | 0.0 | 0.0 |
| SN(E/C) |
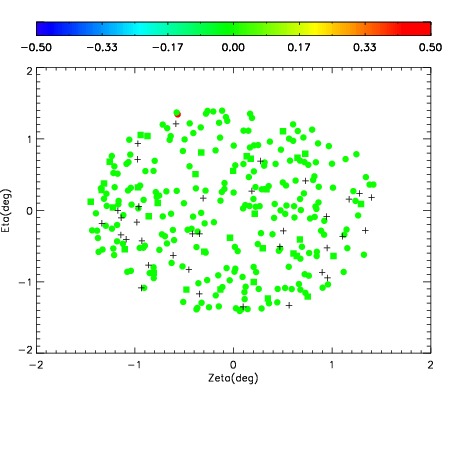
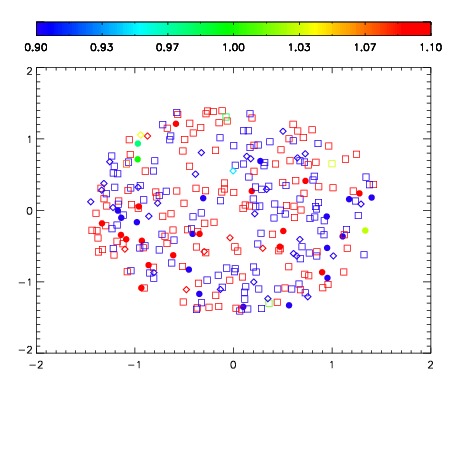
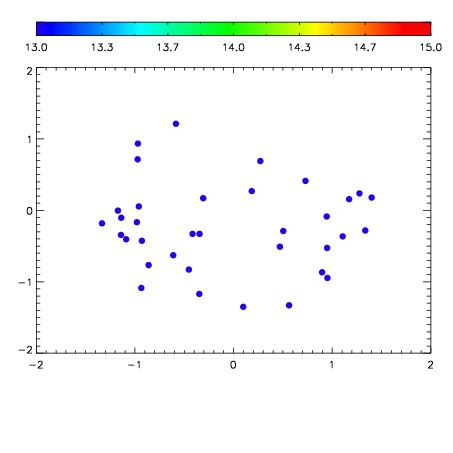

| Frame | Nreads | Zeropoints | Mag plots | Spatial mag deviation | Spatial sky 16325A emission deviations (filled: sky, open: star) | Spatial sky continuum emission | Spatial sky telluric CO2 absorption deviations (filled: H < 10) | |||||||||||||||||||||||
| 0 | 0 |
|
|
|
|
|
|
| IPAIR | NAME | SHIFT | NEWSHIFT | S/N | NAME | SHIFT | NEWSHIFT | S/N |
| 0 | 10150017 | 0.495196 | 0.00000 | 143.075 | 10150018 | 0.00253257 | 0.492663 | 126.448 |
| 1 | 10150012 | 0.493798 | 0.00139803 | 155.250 | 10150014 | 0.00264473 | 0.492551 | 160.207 |
| 2 | 10150013 | 0.493247 | 0.00194901 | 154.674 | 10150015 | 0.00312064 | 0.492075 | 156.492 |
| 3 | 10150016 | 0.494492 | 0.000704020 | 150.108 | 10150011 | 0.00000 | 0.495196 | 155.059 |