| Red | Green | Blue | |
| z | 17.64 | ||
| znorm | Inf | ||
| sky | -Inf | -NaN | -Inf |
| S/N | 28.0 | 46.5 | 47.5 |
| S/N(c) | 0.0 | 0.0 | 0.0 |
| SN(E/C) |
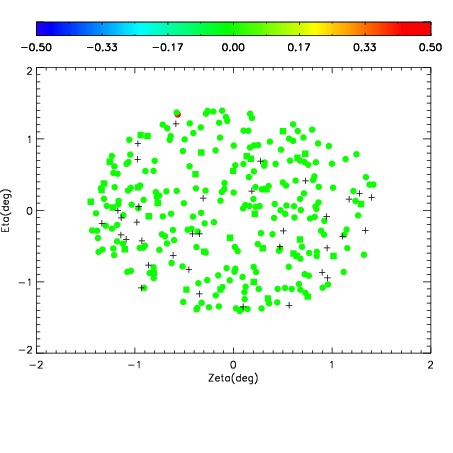
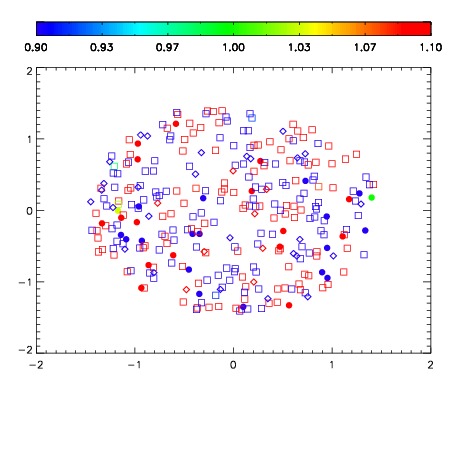
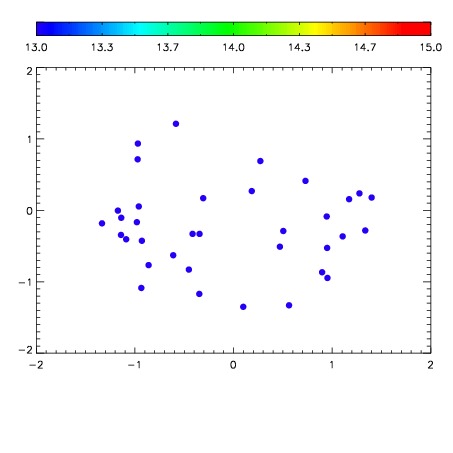

| Frame | Nreads | Zeropoints | Mag plots | Spatial mag deviation | Spatial sky 16325A emission deviations (filled: sky, open: star) | Spatial sky continuum emission | Spatial sky telluric CO2 absorption deviations (filled: H < 10) | |||||||||||||||||||||||
| 0 | 0 |
|
|
|
|
|
|
| IPAIR | NAME | SHIFT | NEWSHIFT | S/N | NAME | SHIFT | NEWSHIFT | S/N |
| 0 | 10450013 | 0.504208 | 0.00000 | 175.361 | 10450014 | 0.00267021 | 0.501538 | 172.548 |
| 1 | 10450017 | 0.503962 | 0.000246048 | 182.013 | 10450015 | 0.00226720 | 0.501941 | 173.930 |
| 2 | 10450016 | 0.504061 | 0.000147045 | 180.488 | 10450018 | 0.00222058 | 0.501987 | 173.592 |
| 3 | 10450012 | 0.503587 | 0.000621021 | 174.835 | 10450011 | 0.00000 | 0.504208 | 169.396 |