| Red | Green | Blue | |
| z | 17.64 | ||
| znorm | Inf | ||
| sky | -Inf | -Inf | -Inf |
| S/N | 23.4 | 40.5 | 42.5 |
| S/N(c) | 0.0 | 0.0 | 0.0 |
| SN(E/C) |
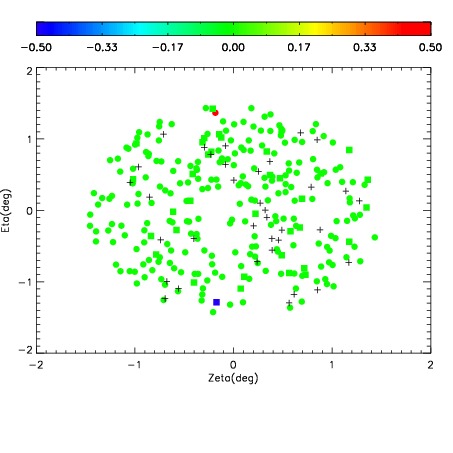
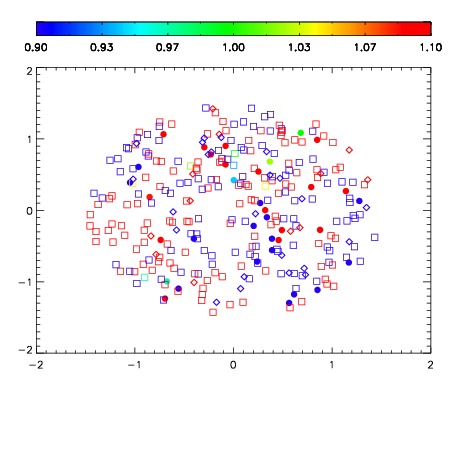
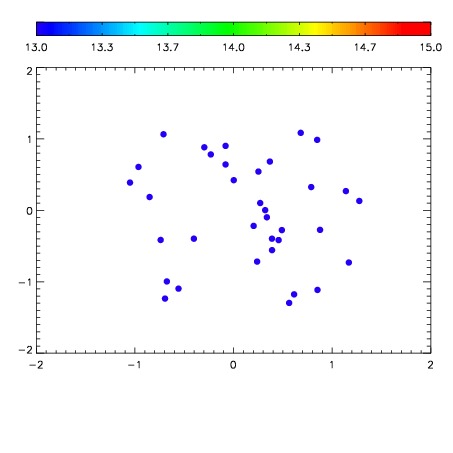

| Frame | Nreads | Zeropoints | Mag plots | Spatial mag deviation | Spatial sky 16325A emission deviations (filled: sky, open: star) | Spatial sky continuum emission | Spatial sky telluric CO2 absorption deviations (filled: H < 10) | |||||||||||||||||||||||
| 0 | 0 |
|
|
|
|
|
|
| IPAIR | NAME | SHIFT | NEWSHIFT | S/N | NAME | SHIFT | NEWSHIFT | S/N |
| 0 | 10420012 | 0.512267 | 0.00000 | 164.621 | 10420011 | 0.00000 | 0.512267 | 174.038 |
| 1 | 10420017 | 0.509189 | 0.00307798 | 191.769 | 10420014 | 0.00126913 | 0.510998 | 196.381 |
| 2 | 10420016 | 0.508976 | 0.00329101 | 188.830 | 10420015 | 0.000943742 | 0.511323 | 191.874 |
| 3 | 10420013 | 0.511840 | 0.000427008 | 185.241 | 10420018 | 0.00140911 | 0.510858 | 189.619 |