| Red | Green | Blue | |
| z | 17.64 | ||
| znorm | Inf | ||
| sky | -Inf | -Inf | -Inf |
| S/N | 22.5 | 38.3 | 40.7 |
| S/N(c) | 0.0 | 0.0 | 0.0 |
| SN(E/C) |

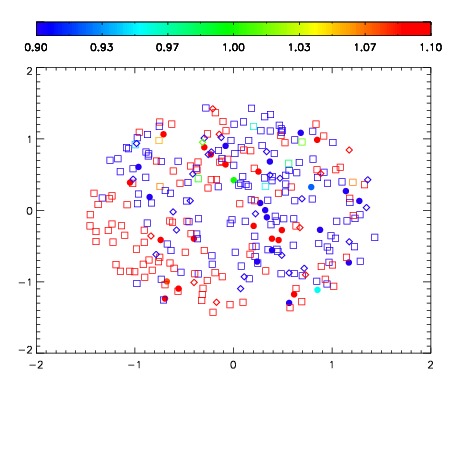
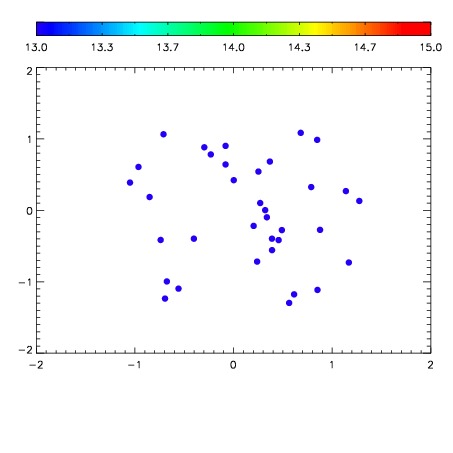

| Frame | Nreads | Zeropoints | Mag plots | Spatial mag deviation | Spatial sky 16325A emission deviations (filled: sky, open: star) | Spatial sky continuum emission | Spatial sky telluric CO2 absorption deviations (filled: H < 10) | |||||||||||||||||||||||
| 0 | 0 |
|
|
|
|
|
|
| IPAIR | NAME | SHIFT | NEWSHIFT | S/N | NAME | SHIFT | NEWSHIFT | S/N |
| 0 | 10490015 | 0.499215 | 0.00000 | 188.041 | 10490016 | 0.00117505 | 0.498040 | 157.949 |
| 1 | 10490019 | 0.498850 | 0.000365019 | 202.754 | 10490020 | -0.00127655 | 0.500492 | 205.668 |
| 2 | 10490018 | 0.498836 | 0.000378996 | 193.413 | 10490013 | 0.00000 | 0.499215 | 182.332 |