| Red | Green | Blue | |
| z | 17.64 | ||
| znorm | Inf | ||
| sky | -Inf | -Inf | -Inf |
| S/N | 25.4 | 43.9 | 45.3 |
| S/N(c) | 0.0 | 0.0 | 0.0 |
| SN(E/C) |
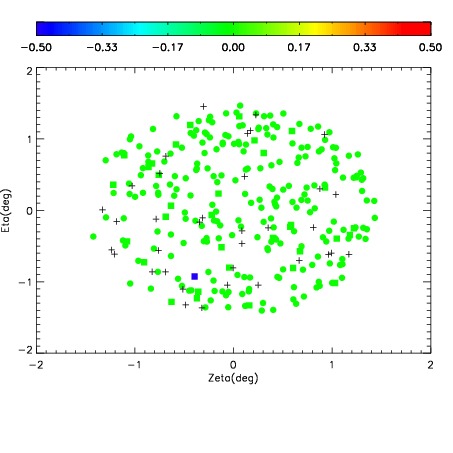
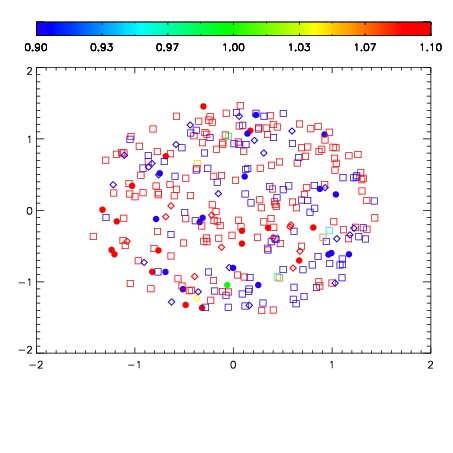


| Frame | Nreads | Zeropoints | Mag plots | Spatial mag deviation | Spatial sky 16325A emission deviations (filled: sky, open: star) | Spatial sky continuum emission | Spatial sky telluric CO2 absorption deviations (filled: H < 10) | |||||||||||||||||||||||
| 0 | 0 |
|
|
|
|
|
|
| IPAIR | NAME | SHIFT | NEWSHIFT | S/N | NAME | SHIFT | NEWSHIFT | S/N |
| 0 | 06690017 | 0.484079 | 0.00000 | 208.889 | 06690015 | -0.00441694 | 0.488496 | 202.693 |
| 1 | 06690016 | 0.483690 | 0.000389010 | 213.640 | 06690018 | 8.50885e-05 | 0.483994 | 211.617 |
| 2 | 06690013 | 0.482806 | 0.00127301 | 208.920 | 06690011 | 0.00000 | 0.484079 | 207.307 |
| 3 | 06690012 | 0.482864 | 0.00121501 | 202.280 | 06690014 | -0.000660597 | 0.484740 | 202.081 |