| Red | Green | Blue | |
| z | 17.64 | ||
| znorm | Inf | ||
| sky | -NaN | -NaN | -Inf |
| S/N | 28.5 | 46.5 | 50.2 |
| S/N(c) | 0.0 | 0.0 | 0.0 |
| SN(E/C) |
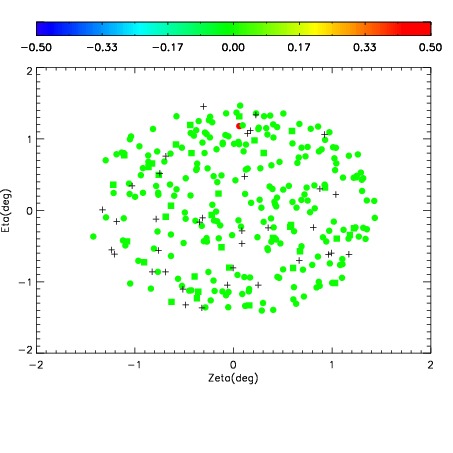
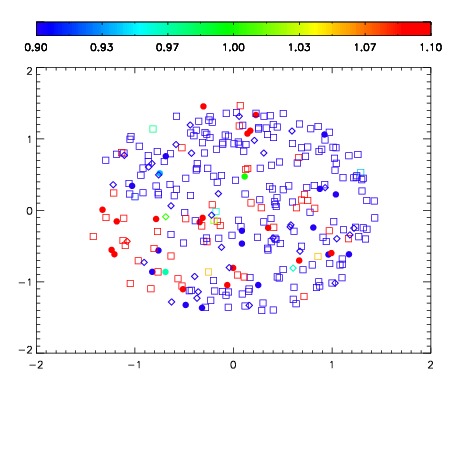
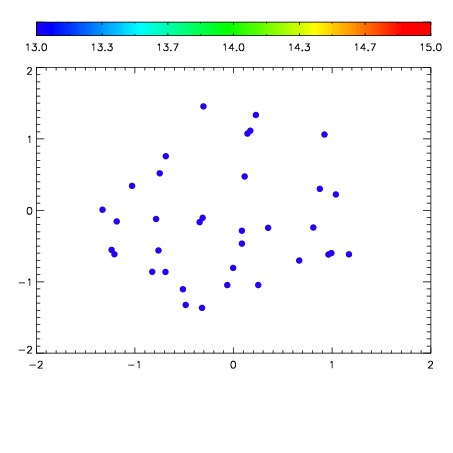

| Frame | Nreads | Zeropoints | Mag plots | Spatial mag deviation | Spatial sky 16325A emission deviations (filled: sky, open: star) | Spatial sky continuum emission | Spatial sky telluric CO2 absorption deviations (filled: H < 10) | |||||||||||||||||||||||
| 0 | 0 |
|
|
|
|
|
|
| IPAIR | NAME | SHIFT | NEWSHIFT | S/N | NAME | SHIFT | NEWSHIFT | S/N |
| 0 | 08780057 | 0.475728 | 0.00000 | 227.716 | 08780055 | 0.00141112 | 0.474317 | 228.471 |
| 1 | 08780058 | 0.474413 | 0.00131500 | 228.309 | 08780059 | -0.000951854 | 0.476680 | 231.314 |
| 2 | 08780054 | 0.473589 | 0.00213900 | 227.002 | 08780056 | 0.000576637 | 0.475151 | 228.386 |
| 3 | 08780053 | 0.473045 | 0.00268301 | 224.459 | 08780052 | 0.00000 | 0.475728 | 218.697 |