| Red | Green | Blue | |
| z | 17.64 | ||
| znorm | Inf | ||
| sky | -Inf | -Inf | -Inf |
| S/N | 17.0 | 29.2 | 29.9 |
| S/N(c) | 0.0 | 0.0 | 0.0 |
| SN(E/C) |
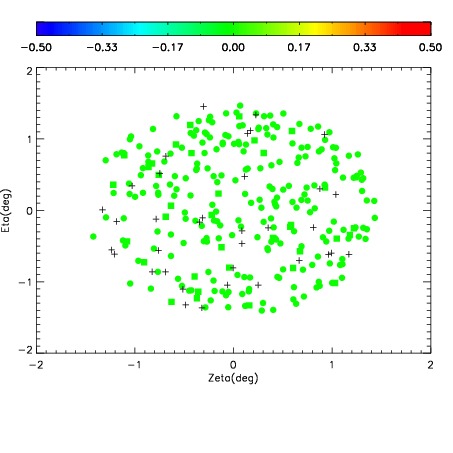
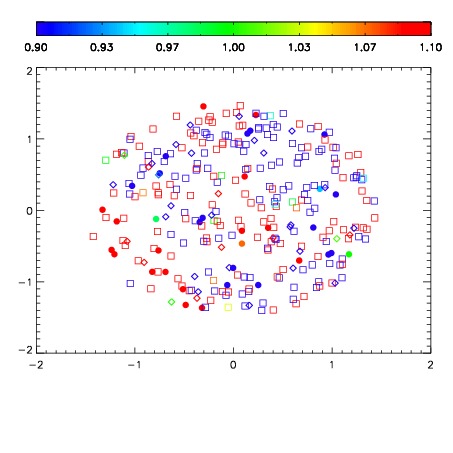
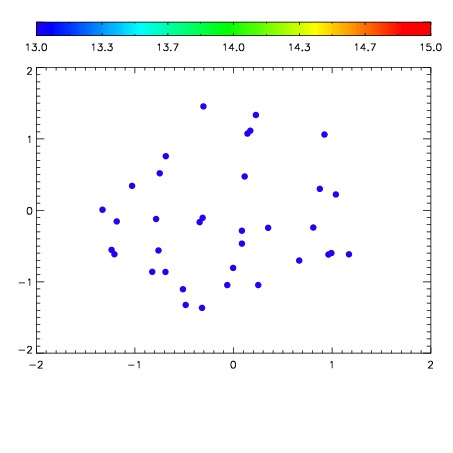

| Frame | Nreads | Zeropoints | Mag plots | Spatial mag deviation | Spatial sky 16325A emission deviations (filled: sky, open: star) | Spatial sky continuum emission | Spatial sky telluric CO2 absorption deviations (filled: H < 10) | |||||||||||||||||||||||
| 0 | 0 |
|
|
|
|
|
|
| IPAIR | NAME | SHIFT | NEWSHIFT | S/N | NAME | SHIFT | NEWSHIFT | S/N |
| 0 | 08870011 | 0.487663 | 0.00000 | 188.809 | 08870010 | 0.00000 | 0.487663 | 210.440 |
| 1 | 08870012 | 0.487654 | 9.00030e-06 | 182.543 | 08870013 | -0.00150063 | 0.489164 | 200.116 |
| 2 | 08870015 | 0.487559 | 0.000104010 | 130.834 | 08870014 | -0.00151197 | 0.489175 | 151.054 |
| 3 | 08870016 | 0.487486 | 0.000176996 | 110.397 | 08870017 | -0.00145970 | 0.489123 | 115.236 |