| Red | Green | Blue | |
| z | 17.64 | ||
| znorm | Inf | ||
| sky | -Inf | -Inf | -Inf |
| S/N | 28.0 | 47.0 | 48.6 |
| S/N(c) | 0.0 | 0.0 | 0.0 |
| SN(E/C) |

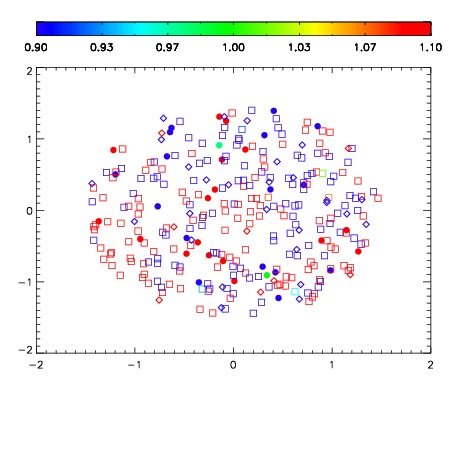
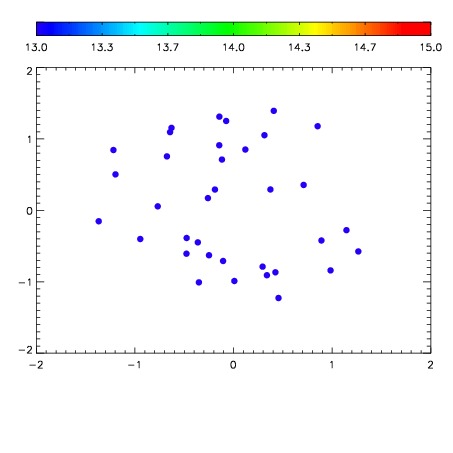

| Frame | Nreads | Zeropoints | Mag plots | Spatial mag deviation | Spatial sky 16325A emission deviations (filled: sky, open: star) | Spatial sky continuum emission | Spatial sky telluric CO2 absorption deviations (filled: H < 10) | |||||||||||||||||||||||
| 0 | 0 |
|
|
|
|
|
|
| IPAIR | NAME | SHIFT | NEWSHIFT | S/N | NAME | SHIFT | NEWSHIFT | S/N |
| 0 | 06680012 | 0.488412 | 0.00000 | 229.218 | 06680013 | 0.00356103 | 0.484851 | 226.927 |
| 1 | 06680016 | 0.487943 | 0.000468999 | 236.233 | 06680017 | 0.00394260 | 0.484469 | 235.844 |
| 2 | 06680015 | 0.488092 | 0.000319988 | 234.824 | 06680014 | 0.00292323 | 0.485489 | 230.915 |
| 3 | 06680011 | 0.487932 | 0.000479996 | 227.034 | 06680010 | 0.00000 | 0.488412 | 222.820 |