| Red | Green | Blue | |
| z | 17.64 | ||
| znorm | Inf | ||
| sky | -Inf | -Inf | -Inf |
| S/N | 28.5 | 46.4 | 50.9 |
| S/N(c) | 0.0 | 0.0 | 0.0 |
| SN(E/C) |
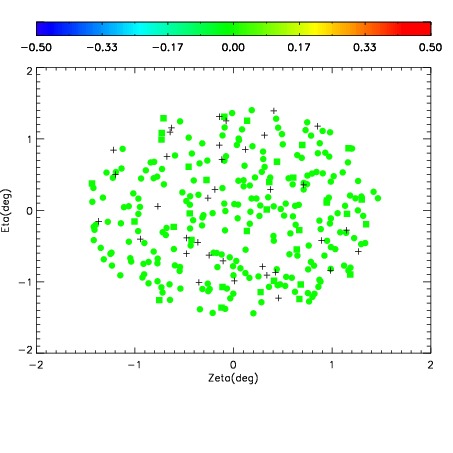
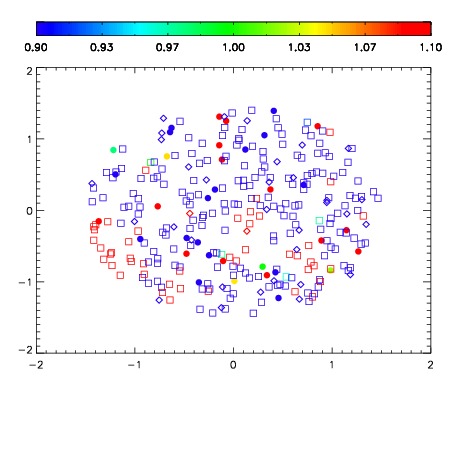
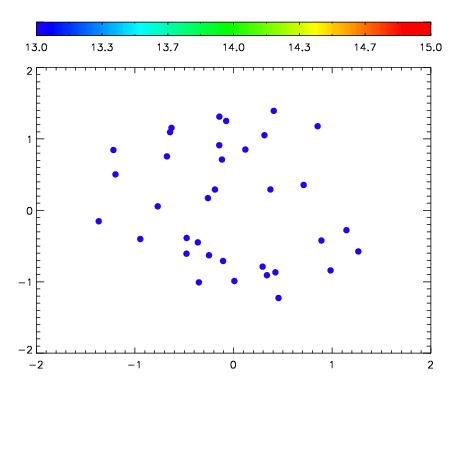

| Frame | Nreads | Zeropoints | Mag plots | Spatial mag deviation | Spatial sky 16325A emission deviations (filled: sky, open: star) | Spatial sky continuum emission | Spatial sky telluric CO2 absorption deviations (filled: H < 10) | |||||||||||||||||||||||
| 0 | 0 |
|
|
|
|
|
|
| IPAIR | NAME | SHIFT | NEWSHIFT | S/N | NAME | SHIFT | NEWSHIFT | S/N |
| 0 | 09070063 | 0.478189 | 0.00000 | 222.442 | 09070058 | 0.00000 | 0.478189 | 222.030 |
| 1 | 09070060 | 0.478116 | 7.29859e-05 | 225.085 | 09070065 | 0.00107671 | 0.477112 | 224.895 |
| 2 | 09070059 | 0.476972 | 0.00121698 | 223.595 | 09070061 | -0.000320076 | 0.478509 | 224.628 |
| 3 | 09070064 | 0.477265 | 0.000923991 | 223.238 | 09070062 | 0.000232898 | 0.477956 | 222.512 |