| Red | Green | Blue | |
| z | 17.64 | ||
| znorm | Inf | ||
| sky | -Inf | -Inf | -Inf |
| S/N | 25.8 | 43.6 | 44.2 |
| S/N(c) | 0.0 | 0.0 | 0.0 |
| SN(E/C) |
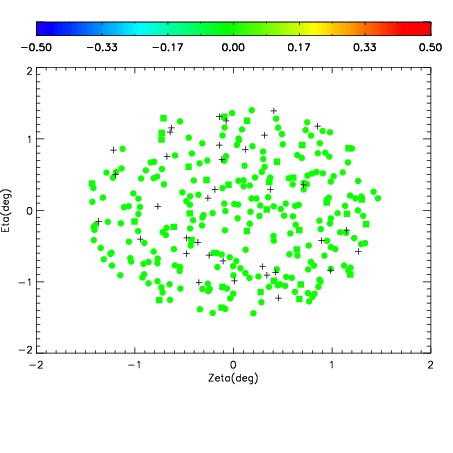
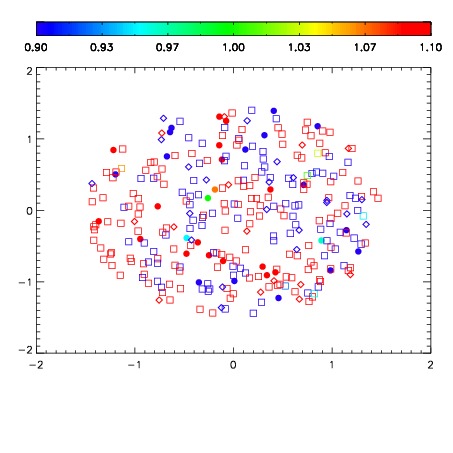
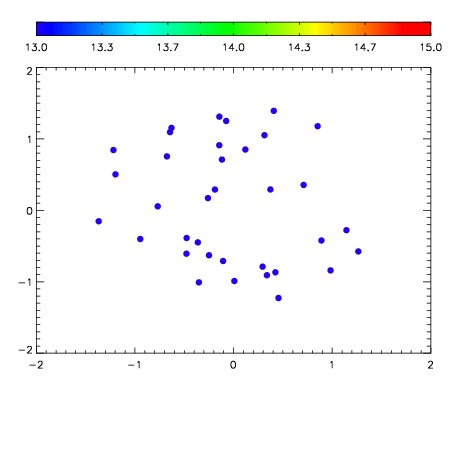

| Frame | Nreads | Zeropoints | Mag plots | Spatial mag deviation | Spatial sky 16325A emission deviations (filled: sky, open: star) | Spatial sky continuum emission | Spatial sky telluric CO2 absorption deviations (filled: H < 10) | |||||||||||||||||||||||
| 0 | 0 |
|
|
|
|
|
|
| IPAIR | NAME | SHIFT | NEWSHIFT | S/N | NAME | SHIFT | NEWSHIFT | S/N |
| 0 | 10040013 | 0.473104 | 0.00000 | 228.886 | 10040015 | 0.00127361 | 0.471830 | 227.776 |
| 1 | 10040017 | 0.472683 | 0.000420988 | 233.821 | 10040018 | 0.000488419 | 0.472616 | 233.690 |
| 2 | 10040016 | 0.471733 | 0.00137100 | 230.545 | 10040014 | 0.000740110 | 0.472364 | 229.476 |
| 3 | 10040012 | 0.472709 | 0.000395000 | 218.774 | 10040011 | 0.00000 | 0.473104 | 221.133 |