| Red | Green | Blue | |
| z | 17.64 | ||
| znorm | Inf | ||
| sky | -Inf | -Inf | -Inf |
| S/N | 28.0 | 47.0 | 49.9 |
| S/N(c) | 0.0 | 0.0 | 0.0 |
| SN(E/C) |
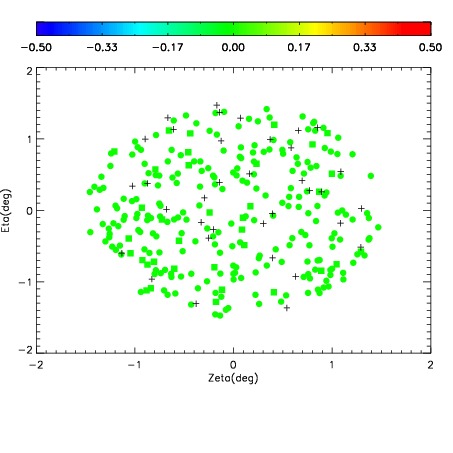
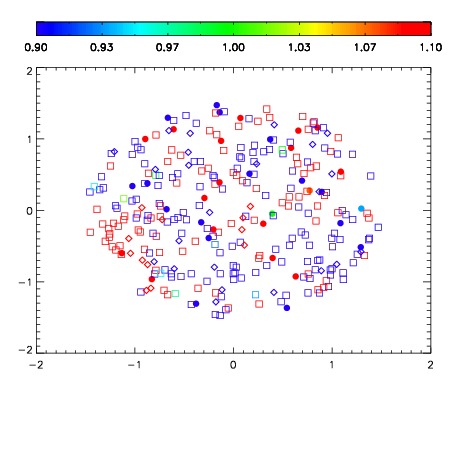
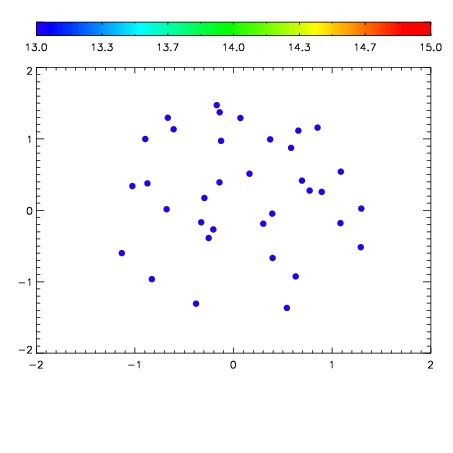

| Frame | Nreads | Zeropoints | Mag plots | Spatial mag deviation | Spatial sky 16325A emission deviations (filled: sky, open: star) | Spatial sky continuum emission | Spatial sky telluric CO2 absorption deviations (filled: H < 10) | |||||||||||||||||||||||
| 0 | 0 |
|
|
|
|
|
|
| IPAIR | NAME | SHIFT | NEWSHIFT | S/N | NAME | SHIFT | NEWSHIFT | S/N |
| 0 | 06670013 | 0.476769 | 0.00000 | 203.883 | 06670014 | 0.00155832 | 0.475211 | 204.298 |
| 1 | 06670012 | 0.476308 | 0.000461012 | 206.984 | 06670011 | 0.00000 | 0.476769 | 206.187 |
| 2 | 06670016 | 0.475479 | 0.00128999 | 193.160 | 06670015 | -0.000563408 | 0.477332 | 196.985 |
| 3 | 06670017 | 0.476438 | 0.000331014 | 184.756 | 06670018 | 0.00534226 | 0.471427 | 183.685 |