| Red | Green | Blue | |
| z | 17.64 | ||
| znorm | Inf | ||
| sky | -Inf | -Inf | -Inf |
| S/N | 28.1 | 47.0 | 49.0 |
| S/N(c) | 0.0 | 0.0 | 0.0 |
| SN(E/C) |
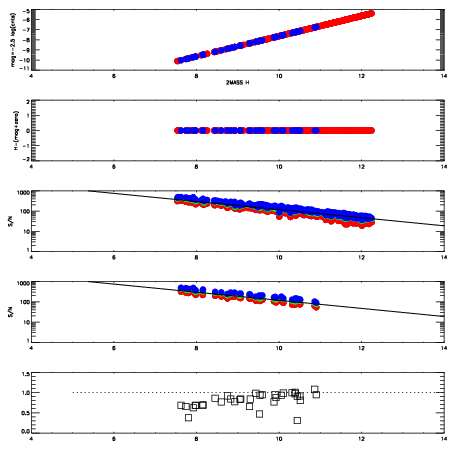

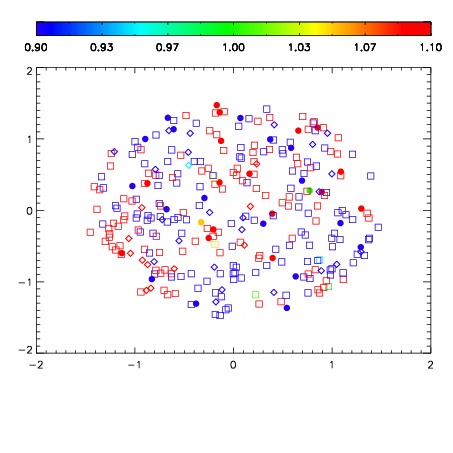
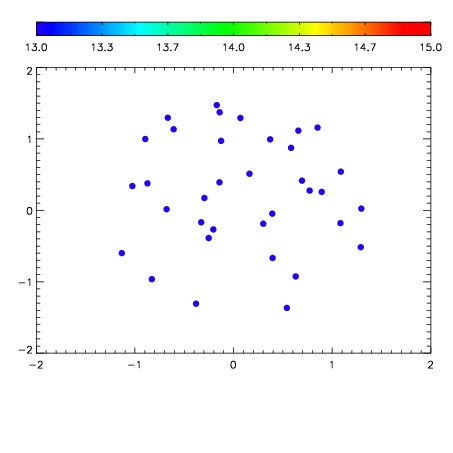

| Frame | Nreads | Zeropoints | Mag plots | Spatial mag deviation | Spatial sky 16325A emission deviations (filled: sky, open: star) | Spatial sky continuum emission | Spatial sky telluric CO2 absorption deviations (filled: H < 10) | |||||||||||||||||||||||
| 0 | 0 |
|
|
|
|
|
|
| IPAIR | NAME | SHIFT | NEWSHIFT | S/N | NAME | SHIFT | NEWSHIFT | S/N |
| 0 | 10100014 | 0.473161 | 0.00000 | 199.956 | 10100016 | 0.00331989 | 0.469841 | 202.254 |
| 1 | 10100018 | 0.473084 | 7.70092e-05 | 213.458 | 10100019 | 0.00416596 | 0.468995 | 212.886 |
| 2 | 10100013 | 0.472399 | 0.000762016 | 211.255 | 10100012 | 0.00000 | 0.473161 | 205.163 |
| 3 | 10100017 | 0.472712 | 0.000449002 | 208.692 | 10100015 | 0.00288077 | 0.470280 | 202.320 |