| Red | Green | Blue | |
| z | 17.64 | ||
| znorm | Inf | ||
| sky | -Inf | -Inf | -Inf |
| S/N | 28.1 | 48.2 | 51.0 |
| S/N(c) | 0.0 | 0.0 | 0.0 |
| SN(E/C) |
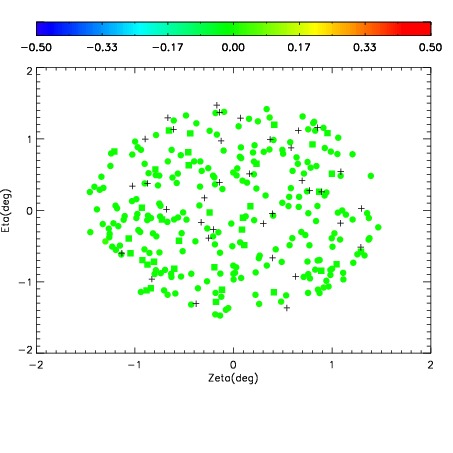
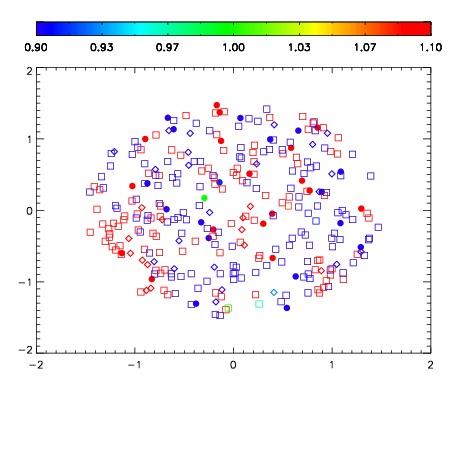
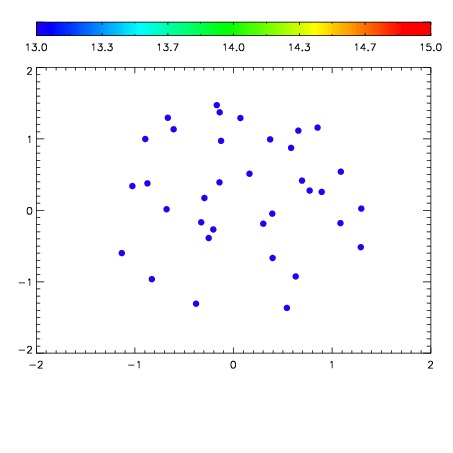

| Frame | Nreads | Zeropoints | Mag plots | Spatial mag deviation | Spatial sky 16325A emission deviations (filled: sky, open: star) | Spatial sky continuum emission | Spatial sky telluric CO2 absorption deviations (filled: H < 10) | |||||||||||||||||||||||
| 0 | 0 |
|
|
|
|
|
|
| IPAIR | NAME | SHIFT | NEWSHIFT | S/N | NAME | SHIFT | NEWSHIFT | S/N |
| 0 | 10160019 | 0.503432 | 0.00000 | 208.847 | 10160016 | 0.00162605 | 0.501806 | 209.739 |
| 1 | 10160018 | 0.503153 | 0.000278950 | 214.471 | 10160017 | 0.00236097 | 0.501071 | 211.143 |
| 2 | 10160015 | 0.502028 | 0.00140399 | 198.785 | 10160020 | 0.00335149 | 0.500080 | 207.309 |
| 3 | 10160014 | 0.501675 | 0.00175697 | 194.680 | 10160013 | 0.00000 | 0.503432 | 197.490 |