| Red | Green | Blue | |
| z | 17.64 | ||
| znorm | Inf | ||
| sky | -Inf | -Inf | -Inf |
| S/N | 33.1 | 56.9 | 60.4 |
| S/N(c) | 0.0 | 0.0 | 0.0 |
| SN(E/C) |
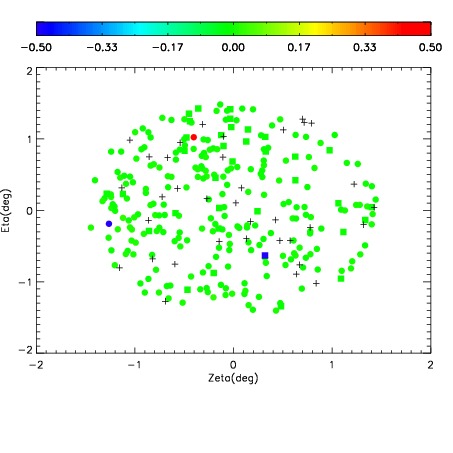


| Frame | Nreads | Zeropoints | Mag plots | Spatial mag deviation | Spatial sky 16325A emission deviations (filled: sky, open: star) | Spatial sky continuum emission | Spatial sky telluric CO2 absorption deviations (filled: H < 10) | |||||||||||||||||||||||
| 0 | 0 |
|
|
|
|
|
|
| IPAIR | NAME | SHIFT | NEWSHIFT | S/N | NAME | SHIFT | NEWSHIFT | S/N |
| 0 | 06680038 | 0.485442 | 0.00000 | 205.135 | 06680039 | 0.000680187 | 0.484762 | 209.110 |
| 1 | 06680034 | 0.483113 | 0.00232902 | 202.902 | 06680035 | 0.00167519 | 0.483767 | 205.426 |
| 2 | 06680037 | 0.484046 | 0.00139600 | 200.407 | 06680036 | 0.00229406 | 0.483148 | 203.359 |
| 3 | 06680033 | 0.482477 | 0.00296500 | 200.118 | 06680032 | 0.00000 | 0.485442 | 200.390 |