| Red | Green | Blue | |
| z | 17.64 | ||
| znorm | Inf | ||
| sky | -Inf | -Inf | -Inf |
| S/N | 32.2 | 55.1 | 59.7 |
| S/N(c) | 0.0 | 0.0 | 0.0 |
| SN(E/C) |
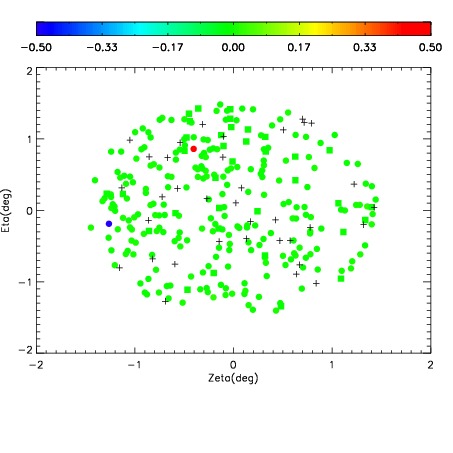
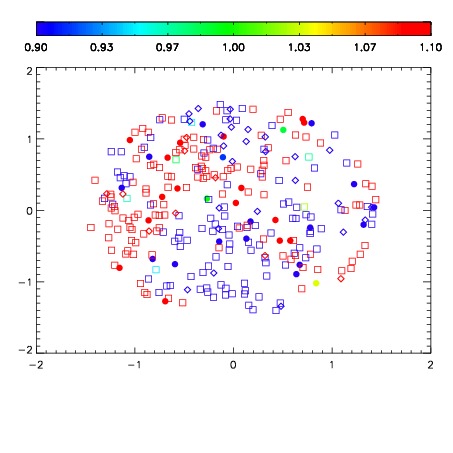
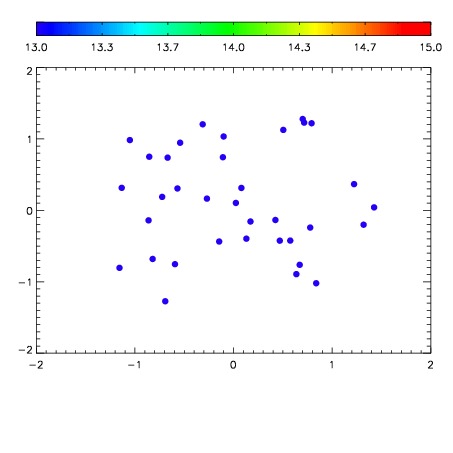

| Frame | Nreads | Zeropoints | Mag plots | Spatial mag deviation | Spatial sky 16325A emission deviations (filled: sky, open: star) | Spatial sky continuum emission | Spatial sky telluric CO2 absorption deviations (filled: H < 10) | |||||||||||||||||||||||
| 0 | 0 |
|
|
|
|
|
|
| IPAIR | NAME | SHIFT | NEWSHIFT | S/N | NAME | SHIFT | NEWSHIFT | S/N |
| 0 | 06990012 | 0.484976 | 0.00000 | 239.844 | 06990017 | 0.00203458 | 0.482941 | 240.672 |
| 1 | 06990016 | 0.484484 | 0.000492007 | 239.533 | 06990014 | 0.00188559 | 0.483090 | 239.944 |
| 2 | 06990015 | 0.480724 | 0.00425199 | 239.120 | 06990013 | 0.00120606 | 0.483770 | 239.545 |
| 3 | 06990011 | 0.482438 | 0.00253800 | 236.854 | 06990010 | 0.00000 | 0.484976 | 234.883 |