| Red | Green | Blue | |
| z | 17.64 | ||
| znorm | Inf | ||
| sky | -Inf | -Inf | -Inf |
| S/N | 15.7 | 28.8 | 29.6 |
| S/N(c) | 0.0 | 0.0 | 0.0 |
| SN(E/C) |
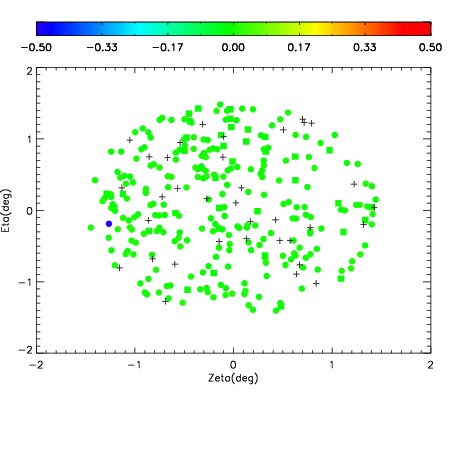
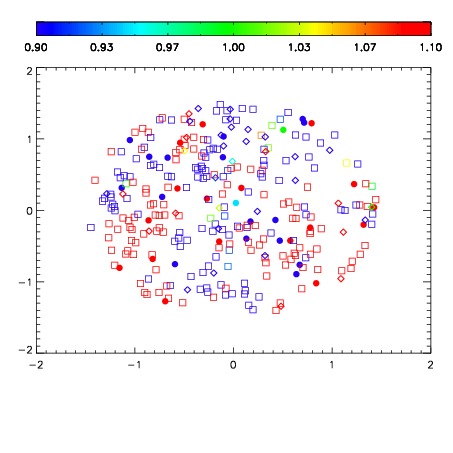


| Frame | Nreads | Zeropoints | Mag plots | Spatial mag deviation | Spatial sky 16325A emission deviations (filled: sky, open: star) | Spatial sky continuum emission | Spatial sky telluric CO2 absorption deviations (filled: H < 10) | |||||||||||||||||||||||
| 0 | 0 |
|
|
|
|
|
|
| IPAIR | NAME | SHIFT | NEWSHIFT | S/N | NAME | SHIFT | NEWSHIFT | S/N |
| 0 | 09170012 | 0.483645 | 0.00000 | 111.080 | 09170015 | 0.00154523 | 0.482100 | 144.540 |
| 1 | 09170016 | 0.480726 | 0.00291899 | 181.252 | 09170011 | 0.00000 | 0.483645 | 169.558 |
| 2 | 09170013 | 0.483275 | 0.000369996 | 104.288 | 09170014 | 0.00223863 | 0.481406 | 121.929 |