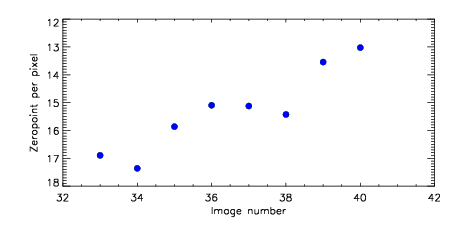
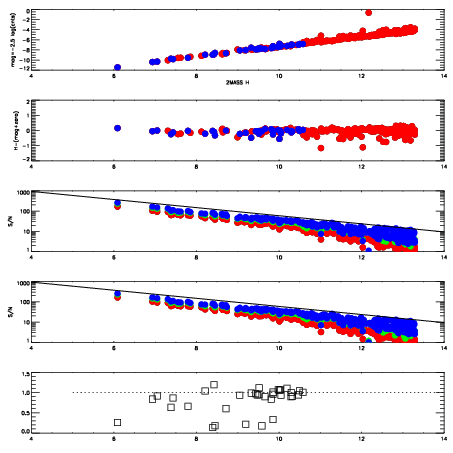
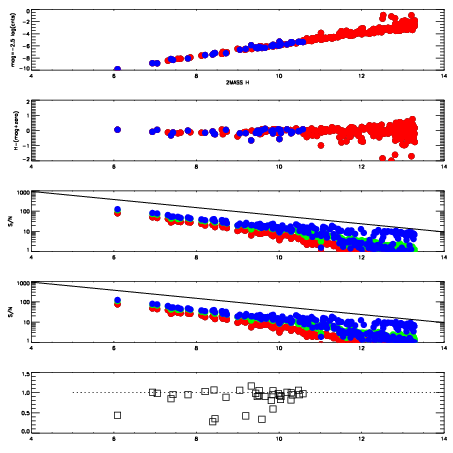
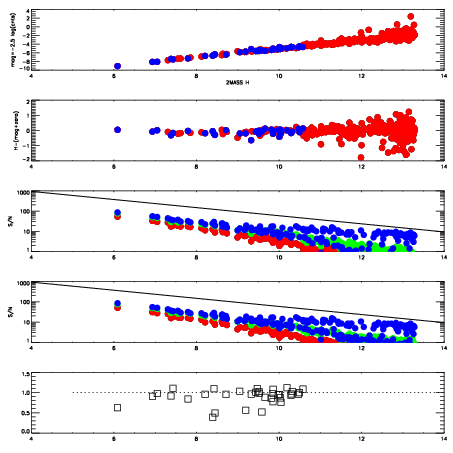
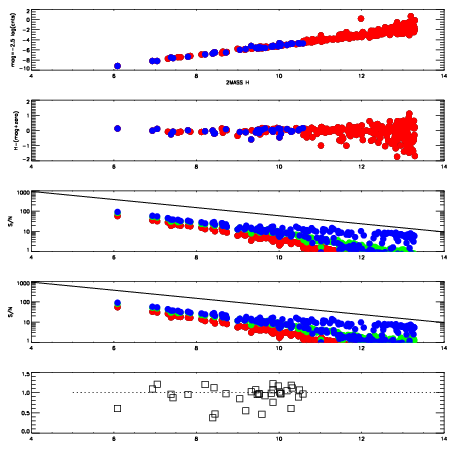
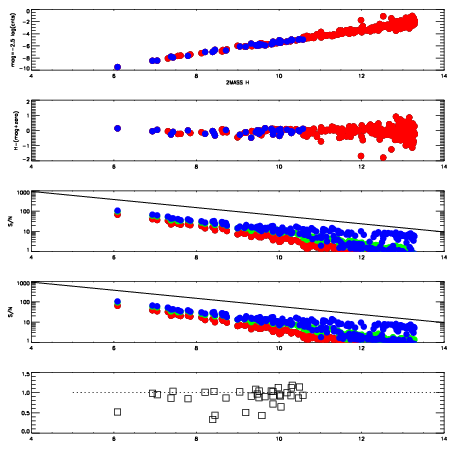
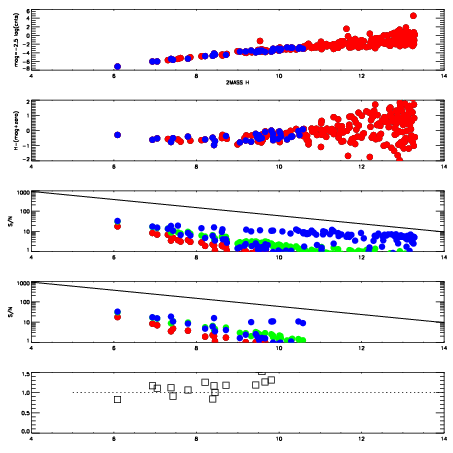
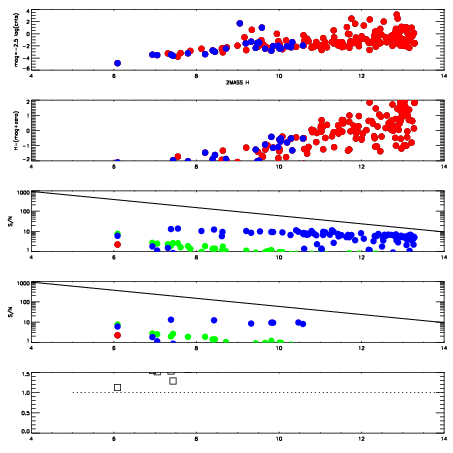
| Frame | Nreads | Zeropoints | Mag plots
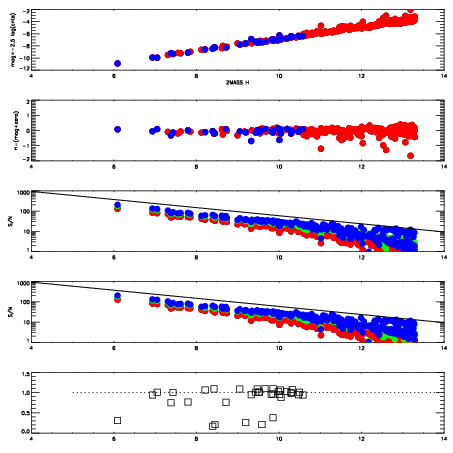
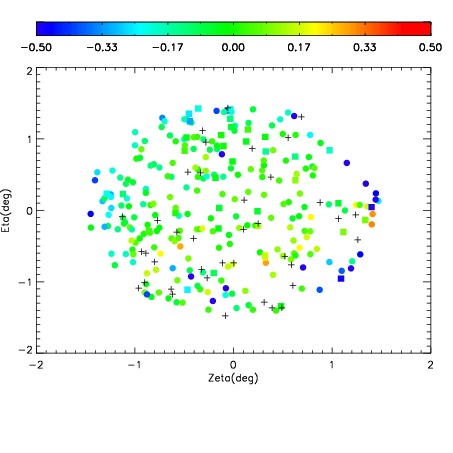
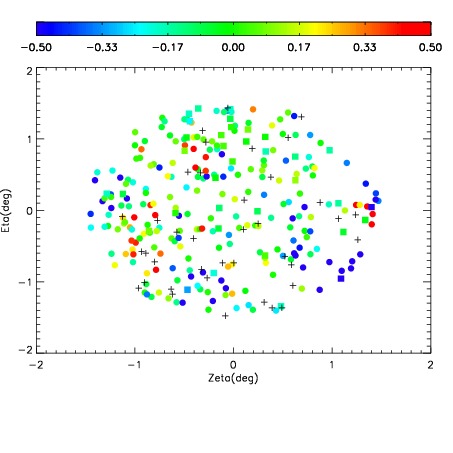
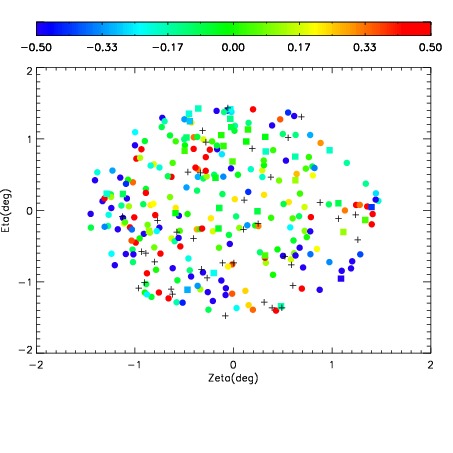
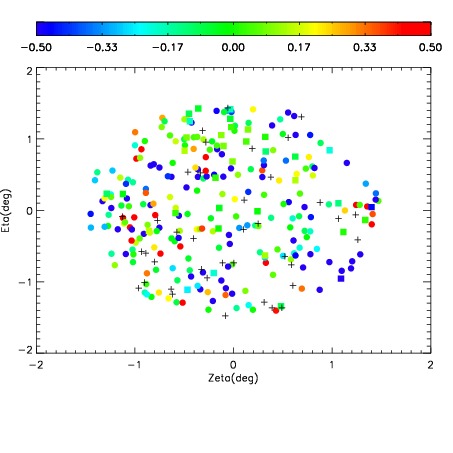
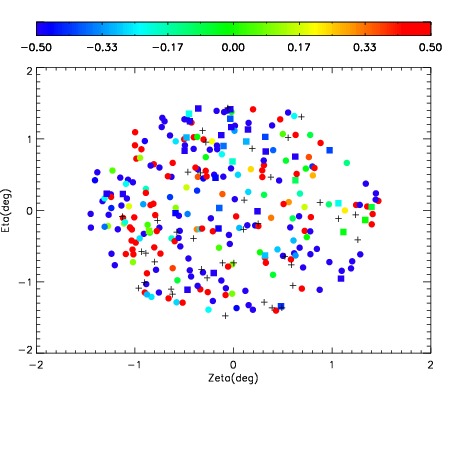
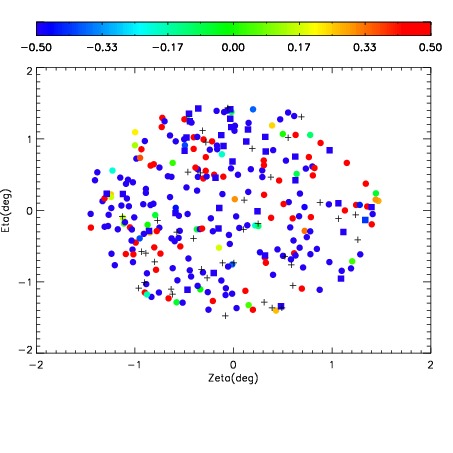
| Spatial mag deviation
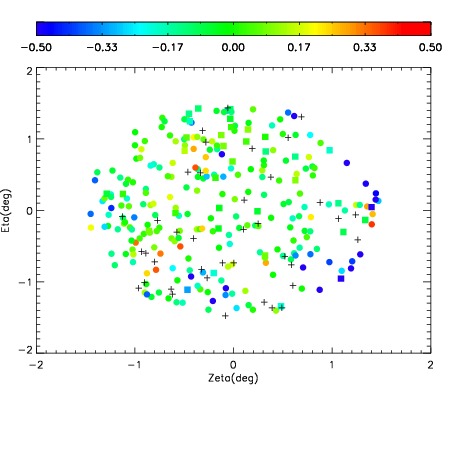
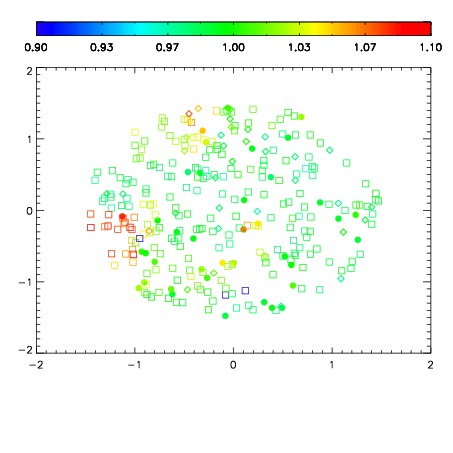
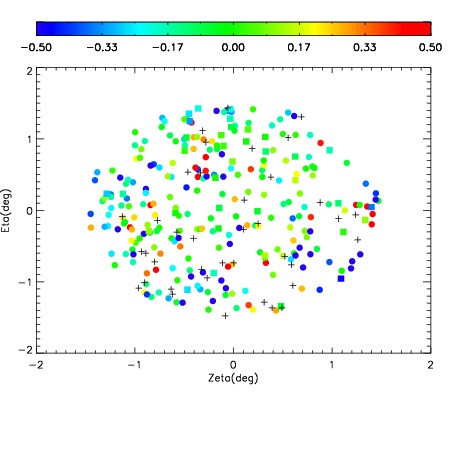
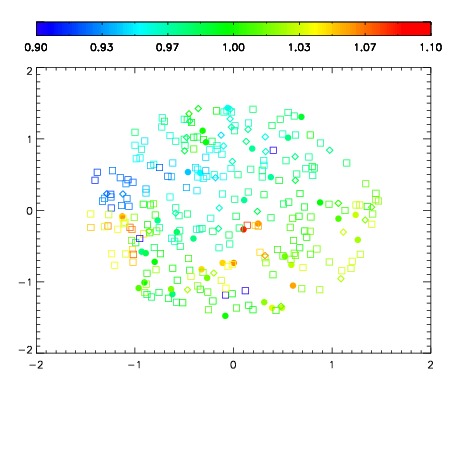
| Spatial sky 16325A emission deviations (filled: sky, open: star)
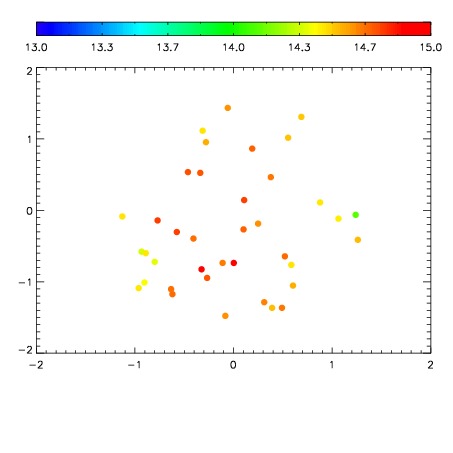
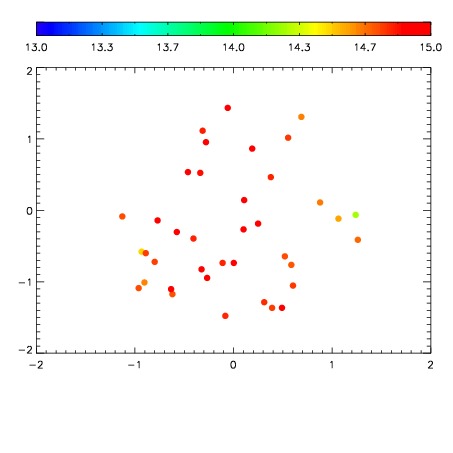
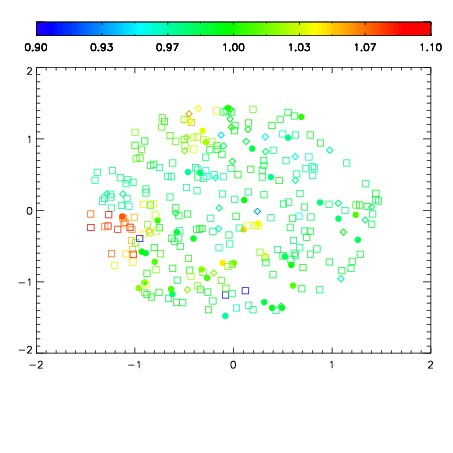
| Spatial sky continuum emission
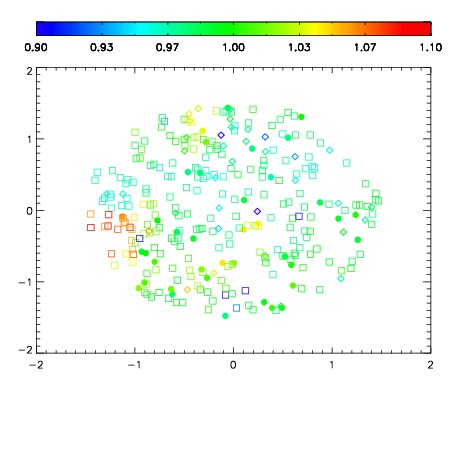
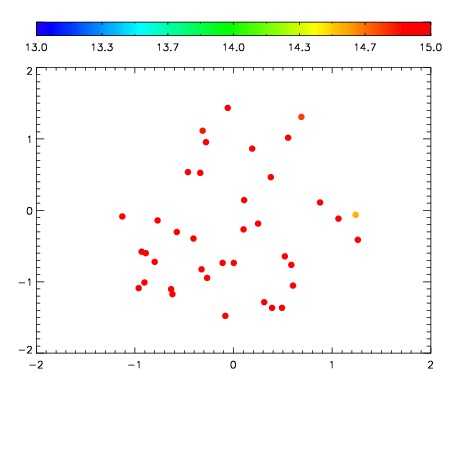
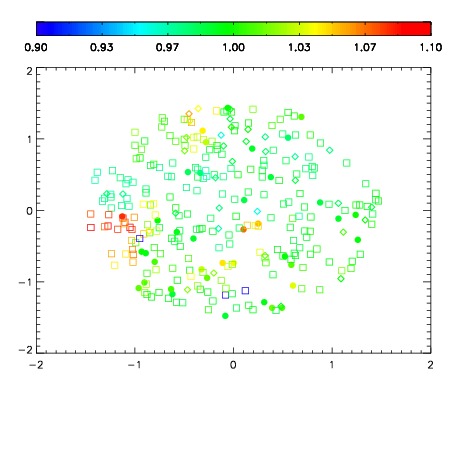
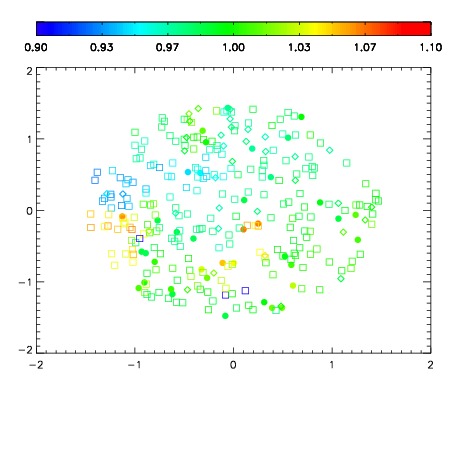
| Spatial sky telluric CO2 absorption deviations (filled: H < 10)
|
| 10270033
| 47
| | Red | Green | Blue
| | z | | 16.90
| | znorm | | 12.72
| | sky | 14.8 | 14.6 | 14.4
| | S/N | 3.1 | 7.5 | 7.0
| | S/N(c) | 2.8 | 6.9 | 6.3
| | SN(E/C) 0.98
|
| 
| 
| 
| 
| 
|
| 10270034
| 47
| | Red | Green | Blue
| | z | | 17.36
| | znorm | | 13.18
| | sky | 15.2 | 14.8 | 15.0
| | S/N | 4.4 | 9.6 | 10.3
| | S/N(c) | 3.9 | 9.0 | 9.1
| | SN(E/C) 0.93
|
| 
| 
| 
| 
| 
|
| 10270035
| 47
| | Red | Green | Blue
| | z | | 15.86
| | znorm | | 11.68
| | sky | 15.2 | 15.0 | 15.4
| | S/N | 1.3 | 3.4 | 2.7
| | S/N(c) | 1.2 | 3.0 | 2.6
| | SN(E/C) 0.95
|
| 
| 
| 
| 
| 
|
| 10270036
| 47
| | Red | Green | Blue
| | z | | 15.10
| | znorm | | 10.91
| | sky | 15.1 | 15.0 | 15.2
| | S/N | 0.7 | 1.8 | 1.4
| | S/N(c) | 0.6 | 1.8 | 1.4
| | SN(E/C) 0.96
|
| 
| 
| 
| 
| 
|
| 10270037
| 47
| | Red | Green | Blue
| | z | | 15.12
| | znorm | | 10.94
| | sky | 14.8 | 15.0 | 15.5
| | S/N | 0.5 | 1.6 | 1.4
| | S/N(c) | 0.5 | 1.6 | 1.3
| | SN(E/C) 0.97
|
| 
| 
| 
| 
| 
|
| 10270038
| 47
| | Red | Green | Blue
| | z | | 15.43
| | znorm | | 11.25
| | sky | 15.1 | 15.1 | 15.5
| | S/N | 0.7 | 2.3 | 2.3
| | S/N(c) | 0.6 | 2.1 | 2.0
| | SN(E/C) 0.94
|
| 
| 
| 
| 
| 
|
| 10270039
| 47
| | Red | Green | Blue
| | z | | 13.54
| | znorm | | 9.36
| | sky | 14.8 | 15.1 | 15.8
| | S/N | 0.3 | 1.0 | 1.0
| | S/N(c) | 0.0 | 0.0 | 0.0
| | SN(E/C) 1.59
|
| 
| 
| 
| 
| 
|
| 10270040
| 47
| | Red | Green | Blue
| | z | | 13.02
| | znorm | | 8.84
| | sky | 15.3 | 15.3 | 16.5
| | S/N | 0.0 | 0.3 | 1.2
| | S/N(c) | 0.0 | 0.0 | 0.0
| | SN(E/C) 2.71
|
| 
| 
| 
| 
| 
|