| Red | Green | Blue | |
| z | 17.66 | ||
| znorm | Inf | ||
| sky | -Inf | -Inf | -Inf |
| S/N | 3.5 | 8.3 | 7.9 |
| S/N(c) | 0.0 | 0.0 | 0.0 |
| SN(E/C) |
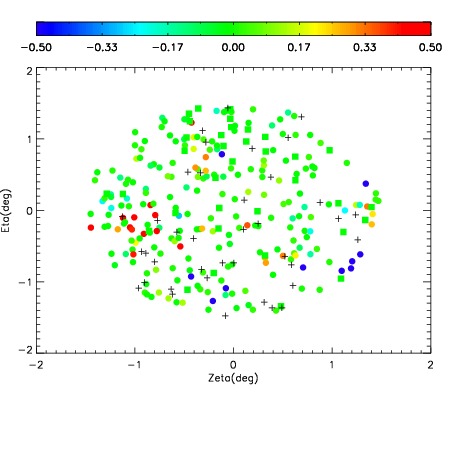
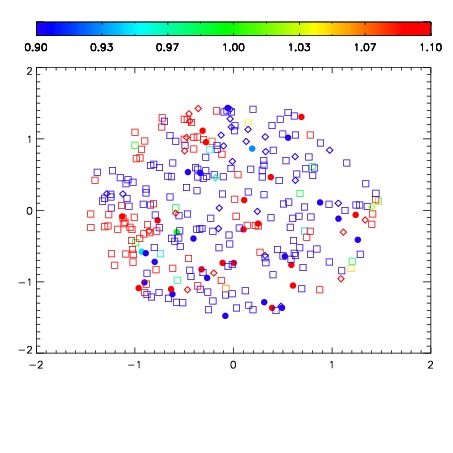
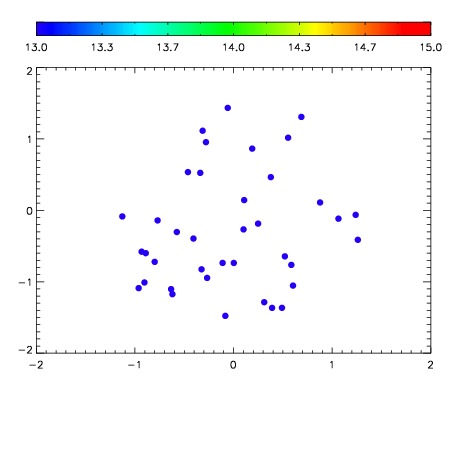

| Frame | Nreads | Zeropoints | Mag plots | Spatial mag deviation | Spatial sky 16325A emission deviations (filled: sky, open: star) | Spatial sky continuum emission | Spatial sky telluric CO2 absorption deviations (filled: H < 10) | |||||||||||||||||||||||
| 0 | 0 |
|
|
|
|
|
|
| IPAIR | NAME | SHIFT | NEWSHIFT | S/N | NAME | SHIFT | NEWSHIFT | S/N |
| 0 | 10270035 | 0.491814 | 0.00000 | 39.7323 | 10270037 | -0.00112798 | 0.492942 | 27.7767 |
| 1 | 10270034 | 0.491035 | 0.000778973 | 80.1756 | 10270033 | 0.00000 | 0.491814 | 65.5704 |
| 2 | 10270038 | 0.490520 | 0.00129399 | 30.8173 | 10270036 | -0.000941483 | 0.492755 | 25.9186 |