| Red | Green | Blue | |
| z | 17.64 | ||
| znorm | Inf | ||
| sky | -Inf | -Inf | -Inf |
| S/N | 14.8 | 29.2 | 29.5 |
| S/N(c) | 0.0 | 0.0 | 0.0 |
| SN(E/C) |
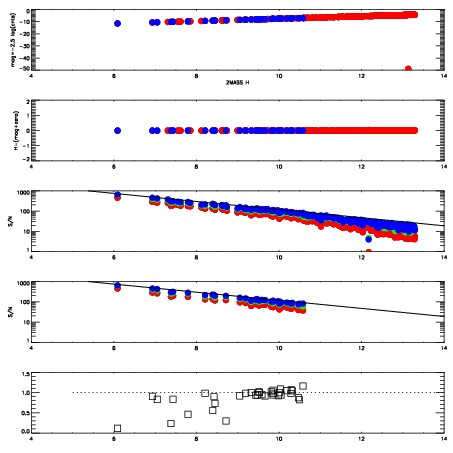
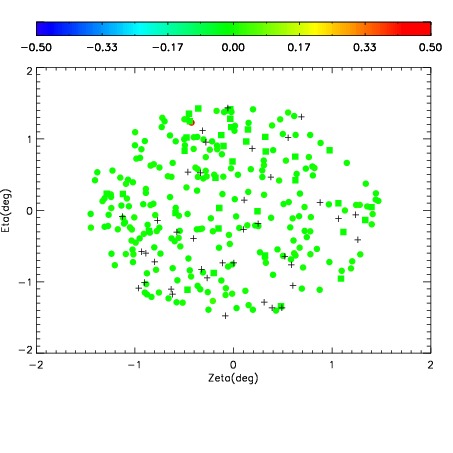
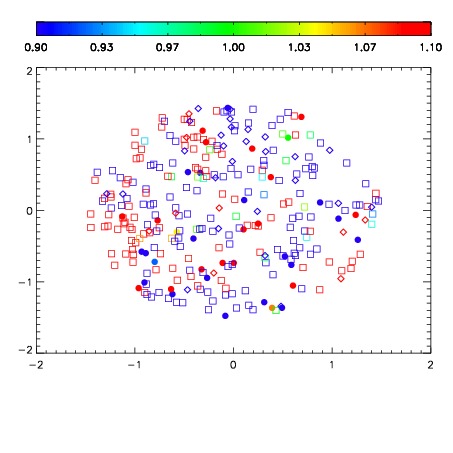
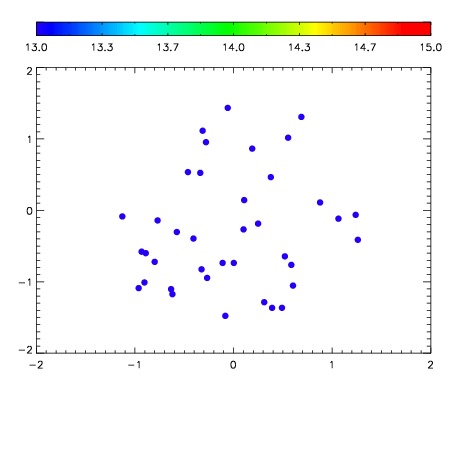

| Frame | Nreads | Zeropoints | Mag plots | Spatial mag deviation | Spatial sky 16325A emission deviations (filled: sky, open: star) | Spatial sky continuum emission | Spatial sky telluric CO2 absorption deviations (filled: H < 10) | |||||||||||||||||||||||
| 0 | 0 |
|
|
|
|
|
|
| IPAIR | NAME | SHIFT | NEWSHIFT | S/N | NAME | SHIFT | NEWSHIFT | S/N |
| 0 | 10370028 | 0.517225 | 0.00000 | 128.537 | 10370030 | 0.000107165 | 0.517118 | 130.288 |
| 1 | 10370031 | 0.516634 | 0.000591040 | 131.347 | 10370029 | 0.000332806 | 0.516892 | 136.648 |
| 2 | 10370032 | 0.516933 | 0.000292003 | 117.953 | 10370033 | 0.00165022 | 0.515575 | 120.905 |
| 3 | 10370027 | 0.517140 | 8.50558e-05 | 116.324 | 10370026 | 0.00000 | 0.517225 | 118.617 |