| Red | Green | Blue | |
| z | 17.64 | ||
| znorm | Inf | ||
| sky | -Inf | -Inf | -Inf |
| S/N | 30.0 | 50.9 | 53.2 |
| S/N(c) | 0.0 | 0.0 | 0.0 |
| SN(E/C) |
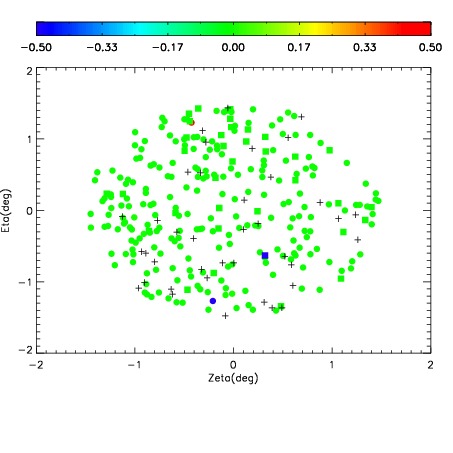
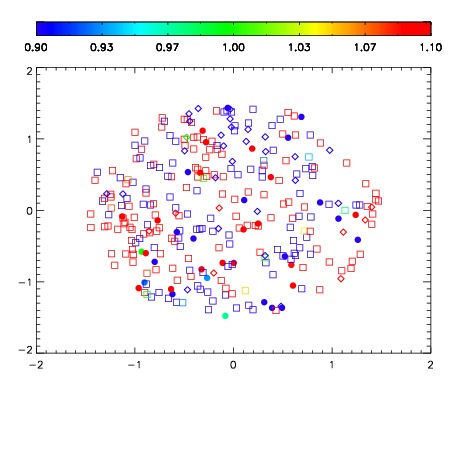
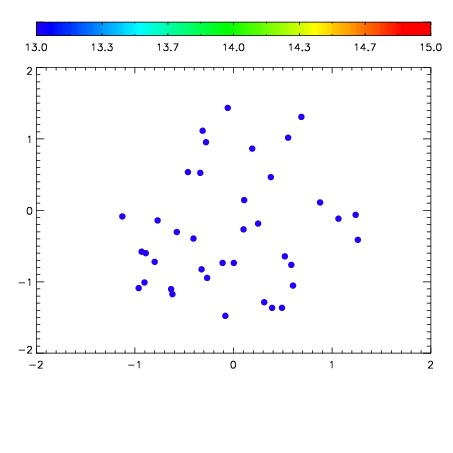

| Frame | Nreads | Zeropoints | Mag plots | Spatial mag deviation | Spatial sky 16325A emission deviations (filled: sky, open: star) | Spatial sky continuum emission | Spatial sky telluric CO2 absorption deviations (filled: H < 10) | |||||||||||||||||||||||
| 0 | 0 |
|
|
|
|
|
|
| IPAIR | NAME | SHIFT | NEWSHIFT | S/N | NAME | SHIFT | NEWSHIFT | S/N |
| 0 | 10410023 | 0.514686 | 0.00000 | 186.434 | 10410026 | 0.00158957 | 0.513096 | 189.468 |
| 1 | 10410027 | 0.514056 | 0.000629961 | 189.165 | 10410029 | 0.00364918 | 0.511037 | 192.421 |
| 2 | 10410024 | 0.514539 | 0.000146985 | 185.936 | 10410025 | 0.00143813 | 0.513248 | 183.286 |
| 3 | 10410028 | 0.514541 | 0.000145018 | 184.305 | 10410022 | 0.00000 | 0.514686 | 174.367 |