| Red | Green | Blue | |
| z | 17.64 | ||
| znorm | Inf | ||
| sky | -NaN | -Inf | -Inf |
| S/N | 27.5 | 46.9 | 49.0 |
| S/N(c) | 0.0 | 0.0 | 0.0 |
| SN(E/C) |
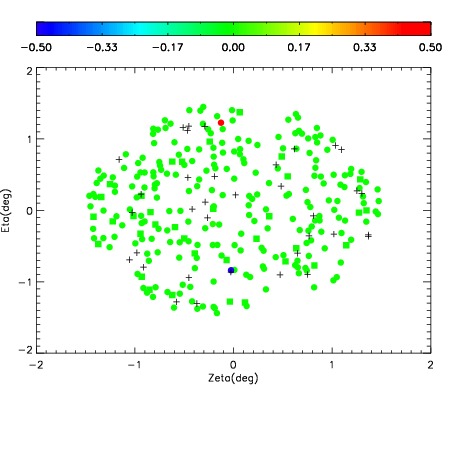
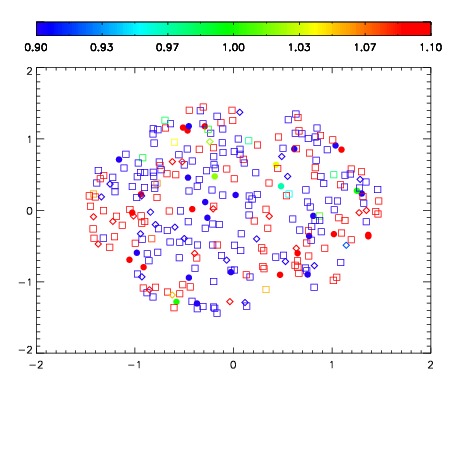


| Frame | Nreads | Zeropoints | Mag plots | Spatial mag deviation | Spatial sky 16325A emission deviations (filled: sky, open: star) | Spatial sky continuum emission | Spatial sky telluric CO2 absorption deviations (filled: H < 10) | |||||||||||||||||||||||
| 0 | 0 |
|
|
|
|
|
|
| IPAIR | NAME | SHIFT | NEWSHIFT | S/N | NAME | SHIFT | NEWSHIFT | S/N |
| 0 | 06980013 | 0.488774 | 0.00000 | 213.735 | 06980014 | 0.00176177 | 0.487012 | 213.751 |
| 1 | 06980012 | 0.486028 | 0.00274602 | 218.114 | 06980011 | 0.00000 | 0.488774 | 217.188 |
| 2 | 06980017 | 0.488254 | 0.000519991 | 209.014 | 06980018 | 0.00298718 | 0.485787 | 209.425 |
| 3 | 06980016 | 0.486248 | 0.00252602 | 208.501 | 06980015 | 0.000792702 | 0.487981 | 209.376 |