| Red | Green | Blue | |
| z | 17.64 | ||
| znorm | Inf | ||
| sky | -Inf | -Inf | -Inf |
| S/N | 27.7 | 46.1 | 49.5 |
| S/N(c) | 0.0 | 0.0 | 0.0 |
| SN(E/C) |
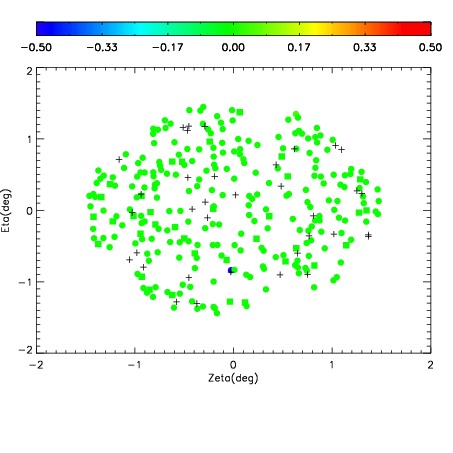
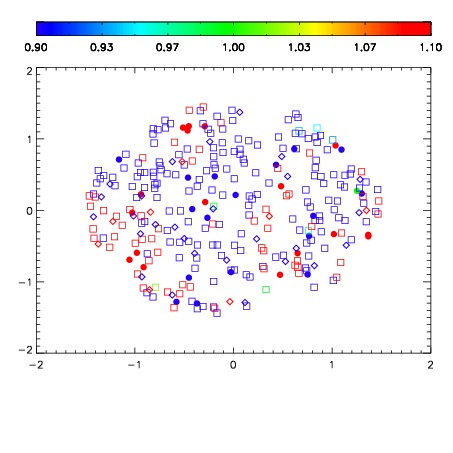
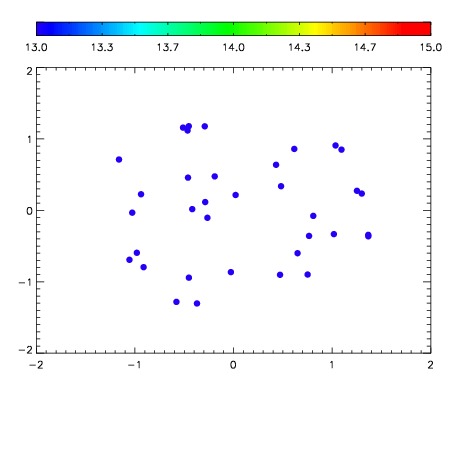

| Frame | Nreads | Zeropoints | Mag plots | Spatial mag deviation | Spatial sky 16325A emission deviations (filled: sky, open: star) | Spatial sky continuum emission | Spatial sky telluric CO2 absorption deviations (filled: H < 10) | |||||||||||||||||||||||
| 0 | 0 |
|
|
|
|
|
|
| IPAIR | NAME | SHIFT | NEWSHIFT | S/N | NAME | SHIFT | NEWSHIFT | S/N |
| 0 | 10200039 | 0.499941 | 0.00000 | 250.408 | 10200037 | 0.00000 | 0.499941 | 256.777 |
| 1 | 10200038 | 0.499697 | 0.000243992 | 249.742 | 10200044 | 0.00196820 | 0.497973 | 250.243 |
| 2 | 10200043 | 0.493966 | 0.00597498 | 248.011 | 10200041 | 0.00152081 | 0.498420 | 246.958 |
| 3 | 10200042 | 0.494227 | 0.00571400 | 244.613 | 10200040 | 0.00246904 | 0.497472 | 241.531 |