| Red | Green | Blue | |
| z | 17.64 | ||
| znorm | Inf | ||
| sky | -Inf | -Inf | -Inf |
| S/N | 28.1 | 47.6 | 51.5 |
| S/N(c) | 0.0 | 0.0 | 0.0 |
| SN(E/C) |
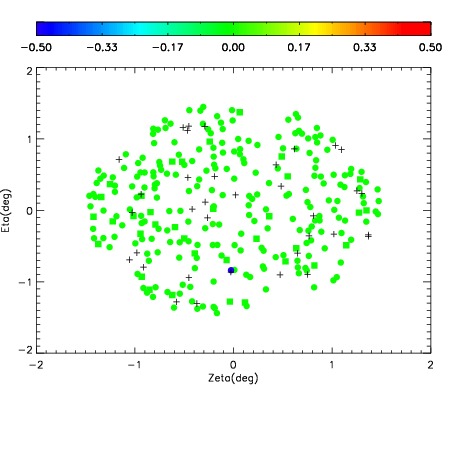
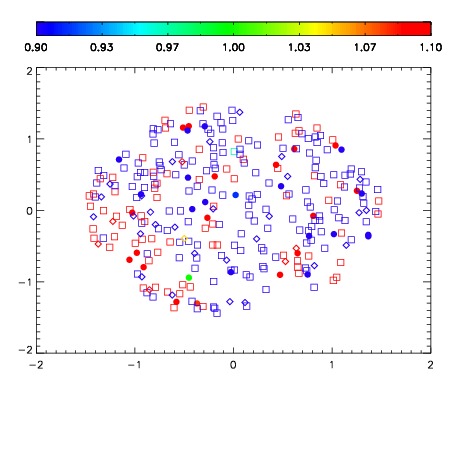


| Frame | Nreads | Zeropoints | Mag plots | Spatial mag deviation | Spatial sky 16325A emission deviations (filled: sky, open: star) | Spatial sky continuum emission | Spatial sky telluric CO2 absorption deviations (filled: H < 10) | |||||||||||||||||||||||
| 0 | 0 |
|
|
|
|
|
|
| IPAIR | NAME | SHIFT | NEWSHIFT | S/N | NAME | SHIFT | NEWSHIFT | S/N |
| 0 | 10260031 | 0.494415 | 0.00000 | 213.144 | 10260032 | 0.00636892 | 0.488046 | 213.268 |
| 1 | 10260027 | 0.493429 | 0.000985980 | 224.255 | 10260028 | 0.00423823 | 0.490177 | 221.288 |
| 2 | 10260026 | 0.493420 | 0.000994980 | 220.077 | 10260025 | 0.00000 | 0.494415 | 220.884 |
| 3 | 10260030 | 0.493415 | 0.000999987 | 216.206 | 10260029 | 0.00463892 | 0.489776 | 217.579 |