| Red | Green | Blue | |
| z | 17.64 | ||
| znorm | Inf | ||
| sky | -Inf | -Inf | -Inf |
| S/N | 28.2 | 47.8 | 51.7 |
| S/N(c) | 0.0 | 0.0 | 0.0 |
| SN(E/C) |
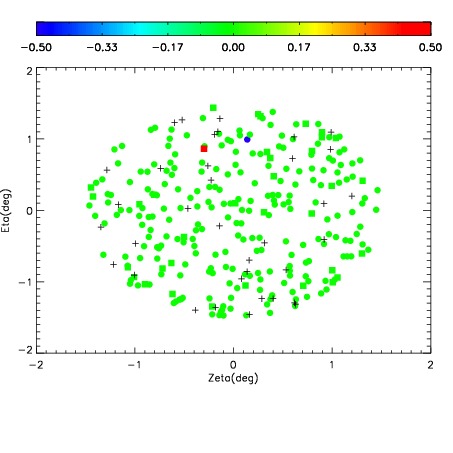
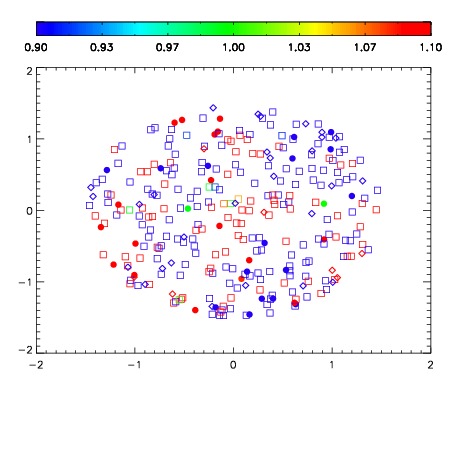
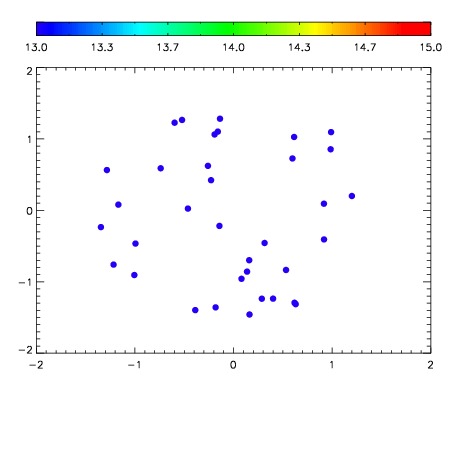

| Frame | Nreads | Zeropoints | Mag plots | Spatial mag deviation | Spatial sky 16325A emission deviations (filled: sky, open: star) | Spatial sky continuum emission | Spatial sky telluric CO2 absorption deviations (filled: H < 10) | |||||||||||||||||||||||
| 0 | 0 |
|
|
|
|
|
|
| IPAIR | NAME | SHIFT | NEWSHIFT | S/N | NAME | SHIFT | NEWSHIFT | S/N |
| 0 | 06660031 | 0.489464 | 0.00000 | 231.216 | 06660028 | 0.0105264 | 0.478938 | 234.048 |
| 1 | 06660030 | 0.489392 | 7.20024e-05 | 234.528 | 06660025 | 0.00000 | 0.489464 | 236.465 |
| 2 | 06660027 | 0.489353 | 0.000111014 | 229.113 | 06660029 | 0.00294894 | 0.486515 | 230.376 |
| 3 | 06660026 | 0.489025 | 0.000439018 | 220.660 | 06660032 | 0.00986005 | 0.479604 | 226.210 |